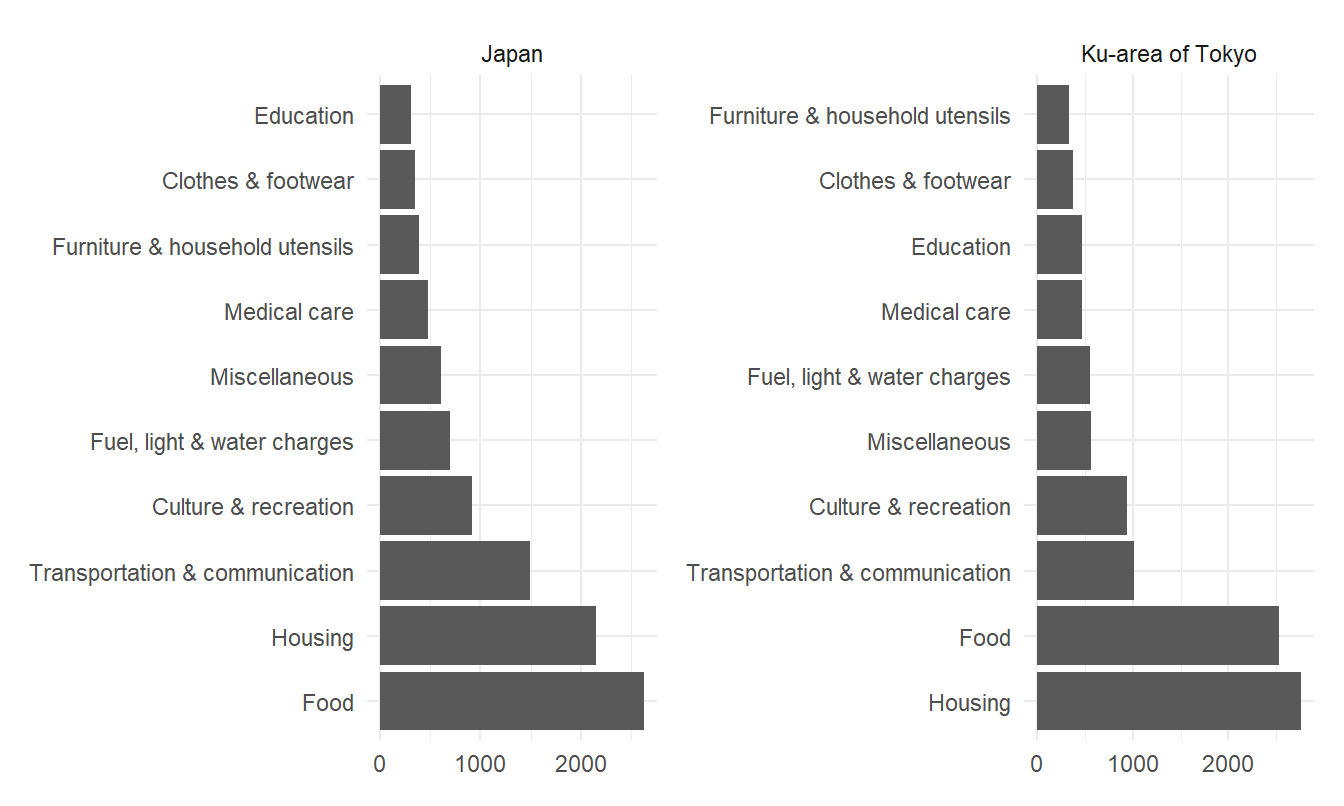
Sys.time()[1] "2024-03-02 15:48:00 JST"Table 1 and Figure 1 show the weights of the consumer price index for Japan as a whole and for Ku-area of Tokyo by major category. See the following link for a definition of “Ku-area of Tokyo”. https://en.wikipedia.org/wiki/Special_wards_of_Tokyo
The category that has the largest weight in Japan as a whole, that is, the category that accounts for the highest proportion of consumer spending, is food, accounting for 26.3% of the total. This was followed by housing at 21.5%, and the two together accounted for 47.8% of consumption expenditure.
Next, looking at Ku-area of Tokyo, the category that accounts for the highest percentage of consumer spending is housing, accounting for 27.6% of the total. This was followed by food at 25.3%, and the two together accounted for 52.9% of consumption expenditure.
Table 2 is a list of weights for each medium category of the consumer price index for Japan as a whole and Ku-area of Tokyo
The category with the largest weight in both Japan as a whole and Ku-area of Tokyo is the rent shown in bold red, accounting for 18.3% of consumption expenditure in Japan as a whole and 24.5% in Ku-area of Tokyo.
The weights are the percentage of households’ consumption expenditures by category or item.
| Large classification | Group Code | Serial number | Japan | Ku-area of Tokyo | |
|---|---|---|---|---|---|
| 1 | All items | 0001 | 001 | 10,000 | 10,000 |
| 2 | Food | 0002 | 002 | 2,626 | 2,529 |
| 3 | Housing | 0045 | 281 | 2,149 | 2,760 |
| 4 | Fuel, light & water charges | 0054 | 310 | 693 | 555 |
| 5 | Furniture & household utensils | 0060 | 321 | 387 | 335 |
| 6 | Clothes & footwear | 0082 | 388 | 353 | 375 |
| 7 | Medical care | 0107 | 471 | 477 | 471 |
| 8 | Transportation & communication | 0111 | 504 | 1,493 | 1,007 |
| 9 | Education | 0118 | 557 | 304 | 465 |
| 10 | Culture & recreation | 0122 | 575 | 911 | 939 |
| 11 | Miscellaneous | 0145 | 669 | 607 | 564 |
| Item | Serial number | Japan | Ku-area of Tokyo | |
|---|---|---|---|---|
| 1 | Food:Cereals | 003 | 214 | 182 |
| 2 | Food:Fish & seafood | 021 | 199 | 175 |
| 3 | Food:Meats | 055 | 249 | 221 |
| 4 | Food:Dairy products & eggs | 067 | 126 | 117 |
| 5 | Food:Vegetables & seaweeds | 079 | 285 | 280 |
| 6 | Food:Fruits | 129 | 105 | 100 |
| 7 | Food:Oils, fats & seasonings | 149 | 121 | 105 |
| 8 | Food:Cakes & candies | 172 | 236 | 213 |
| 9 | Food:Cooked food | 190 | 352 | 346 |
| 10 | Food:Beverages | 222 | 163 | 145 |
| 11 | Food:Alcoholic beverages | 243 | 119 | 110 |
| 12 | Food:Meals outside the home | 253 | 460 | 534 |
| 13 | Housing:Rent | 282 | 1833 | 2454 |
| 14 | Housing:Repairs & maintenance | 290 | 316 | 306 |
| 15 | Fuel, light & water charges:Electricity | 311 | 341 | 262 |
| 16 | Fuel, light & water charges:Gas | 313 | 151 | 151 |
| 17 | Fuel, light & water charges:Other fuel & light | 316 | 38 | 6 |
| 18 | Fuel, light & water charges:Water & sewerage charges | 318 | 163 | 136 |
| 19 | Furniture & household utensils:Household durable goods | 322 | 132 | 111 |
| 20 | Furniture & household utensils:Interior furnishings | 339 | 21 | 19 |
| 21 | Furniture & household utensils:Bedding | 344 | 27 | 23 |
| 22 | Furniture & household utensils:Domestic utensils | 350 | 74 | 73 |
| 23 | Furniture & household utensils:Domestic non-durable goods | 365 | 105 | 87 |
| 24 | Furniture & household utensils:Domestic services | 380 | 28 | 23 |
| 25 | Transportation & communication:Public transportation | 505 | 167 | 235 |
| 26 | Transportation & communication:Private transportation | 524 | 885 | 428 |
| 27 | Transportation & communication:Communication | 550 | 441 | 345 |
| 28 | Education:School fees | 558 | 213 | 323 |
| 29 | Education:School textbooks & reference books for study | 568 | 7 | 6 |
| 30 | Education:Tutorial fees | 571 | 84 | 136 |
| 31 | Culture & recreation:Recreational durable goods | 576 | 77 | 80 |
| 32 | Culture & recreation:Recreational goods | 586 | 206 | 176 |
| 33 | Culture & recreation:Books & other reading materials | 621 | 110 | 105 |
| 34 | Culture & recreation:Recreational services | 631 | 518 | 579 |
| 35 | Miscellaneous:Personal care services | 670 | 110 | 113 |
| 36 | Miscellaneous:Toilet articles | 677 | 161 | 155 |
| 37 | Miscellaneous:Personal effects | 704 | 63 | 75 |
| 38 | Miscellaneous:Tobacco | 716 | 39 | 28 |
| 39 | Miscellaneous:Other miscellaneous | 719 | 233 | 193 |
| 40 | Clothes & footwear:Clothes | 389 | 152 | 170 |
| 41 | Clothes & footwear:Shirts, sweaters & underwear | 423 | 105 | 103 |
| 42 | Clothes & footwear:Footwear | 451 | 48 | 47 |
| 43 | Clothes & footwear:Other clothing | 458 | 29 | 28 |
| 44 | Clothes & footwear:Services related to clothing | 466 | 20 | 27 |
| 45 | Medical care:Medicines & health fortification | 472 | 128 | 117 |
| 46 | Medical care:Medical supplies & appliances | 486 | 91 | 81 |
| 47 | Medical care:Medical services | 499 | 259 | 273 |
Sys.time()[1] "2024-03-02 15:48:00 JST"R.Version()$version.string[1] "R version 4.3.2 Patched (2023-12-27 r85754 ucrt)"quarto::quarto_version()[1] '1.4.542'packageVersion(pkg = "tidyverse")[1] '2.0.0'