What Is The Trend Of The Consumer Price Index In Japan?
Answer
All series are annual data.
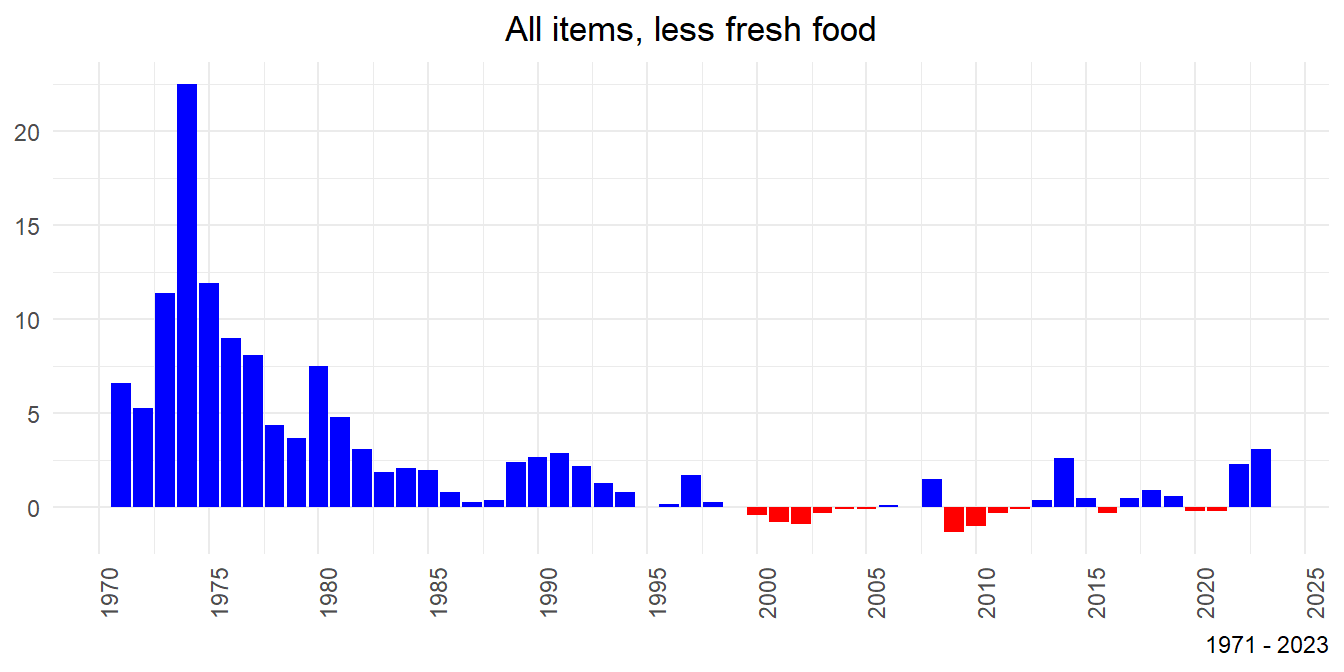
Table 1 shows the time series of the CPI YoY since the consumption tax was raised from 5% to 8% in 2014. It can be seen that the Core CPI(All items, less fresh food) YoY rose sharply to +3.1% in 2023, exceeding the Bank of Japan’s inflation target of +2.0% for the Core CPI YoY for 2 consecutive years.
Table 2 : All items,All items, less fresh food,All items, less imputed rent
Table 3 : All items, less imputed rent & fresh food,All items, less fresh food and energy,All items, less food (less alcoholic beverages) and energy
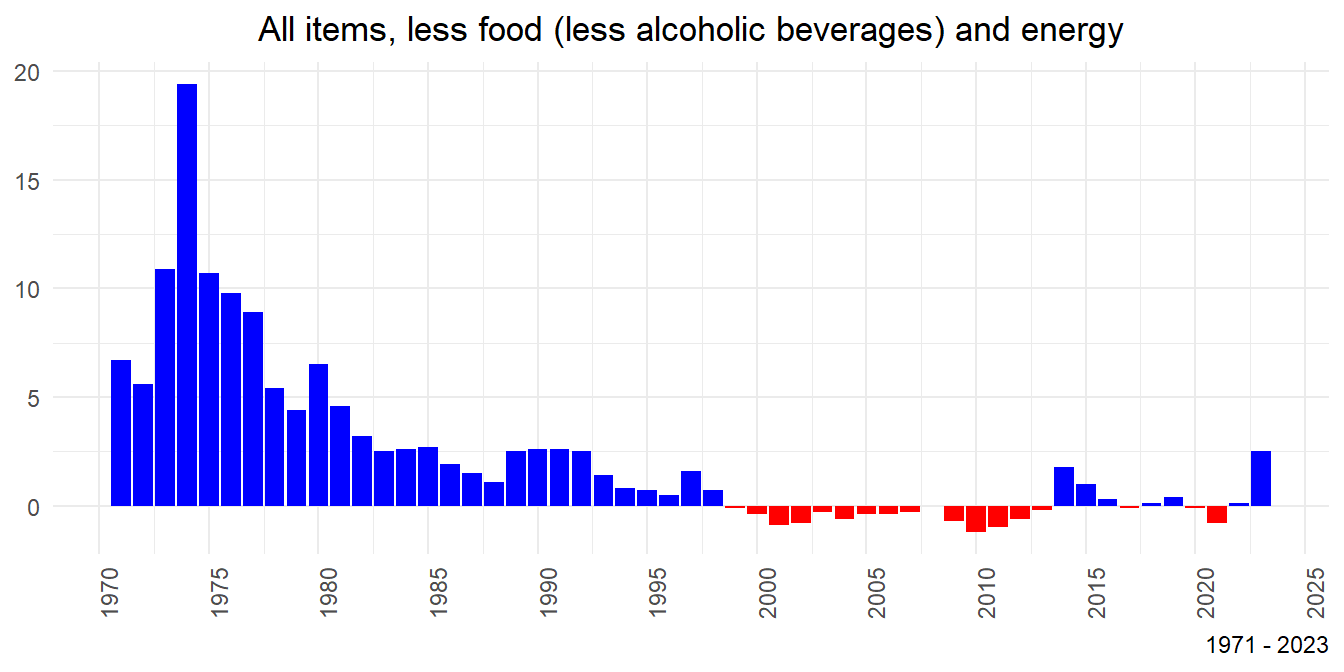
Figure 6 : All items, less food (less alcoholic beverages) and energy
Caution
Japan first introduced a consumption tax (at a rate of 3%) on April 1, 1989. The consumption tax rate was subsequently increased to 5% on April 1, 1997, to 8% on April 1, 2014, and to 10% on October 1, 2019, except for food and beverages and newspapers. Therefore, the year-on-year change in the CPI is affected by these consumption taxes.
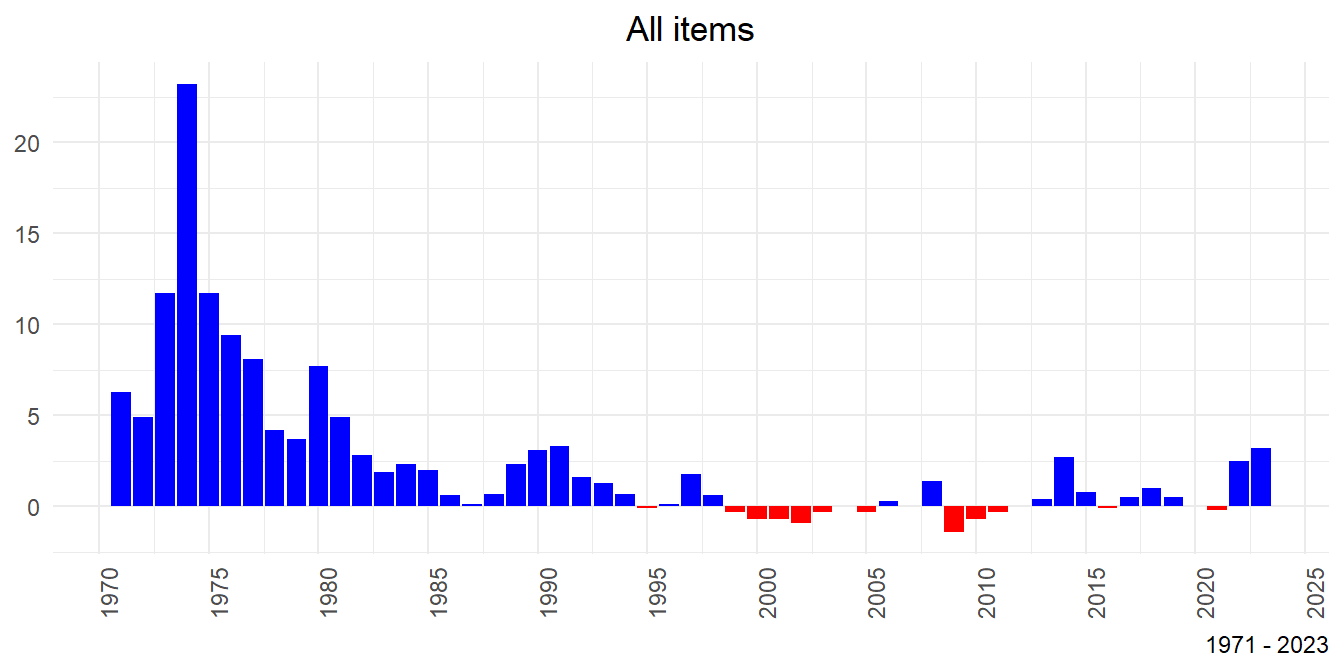
Table 1: Consumer Price Index YoY for the last 10 years
2023
2022
2021
2020
2019
2018
2017
2016
2015
2014
All items
3.2
2.5
-0.2
0.0
0.5
1.0
0.5
-0.1
0.8
2.7
All items, less fresh food
3.1
2.3
-0.2
-0.2
0.6
0.9
0.5
-0.3
0.5
2.6
All items, less imputed rent
3.8
3.0
-0.3
0.0
0.6
1.2
0.6
-0.1
1.0
3.3
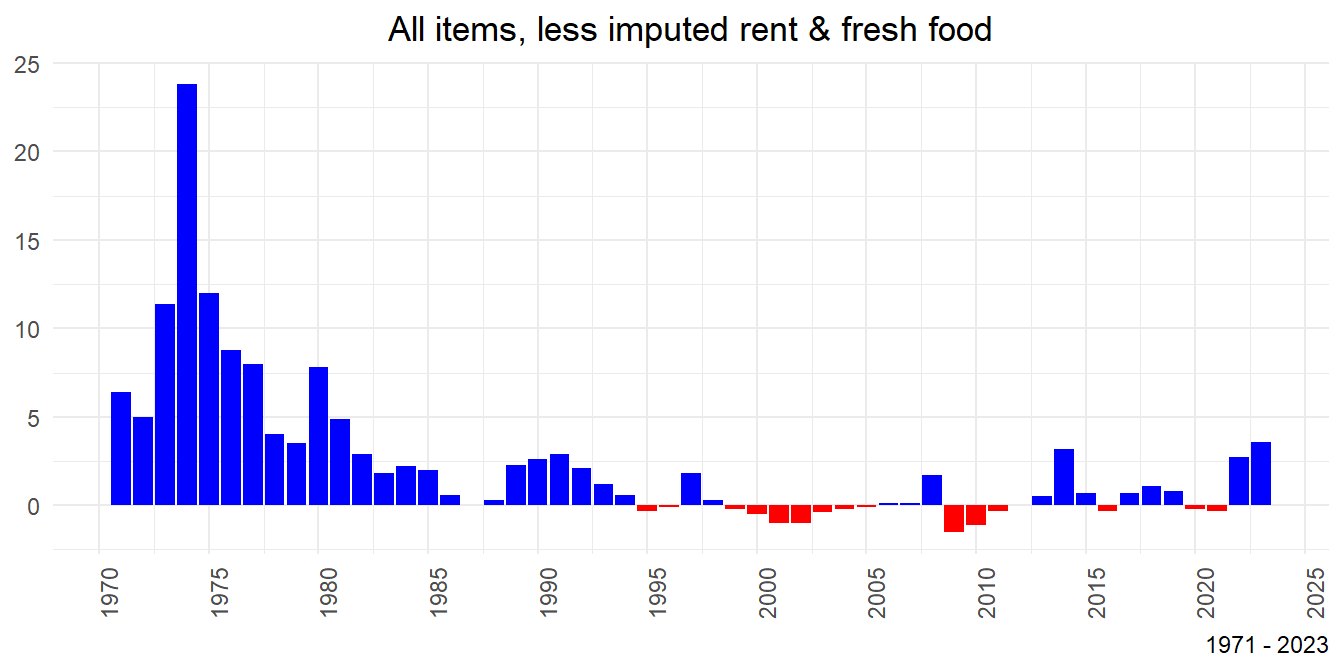
All items, less imputed rent & fresh food
3.6
2.7
-0.3
-0.2
0.8
1.1
0.7
-0.3
0.7
3.2
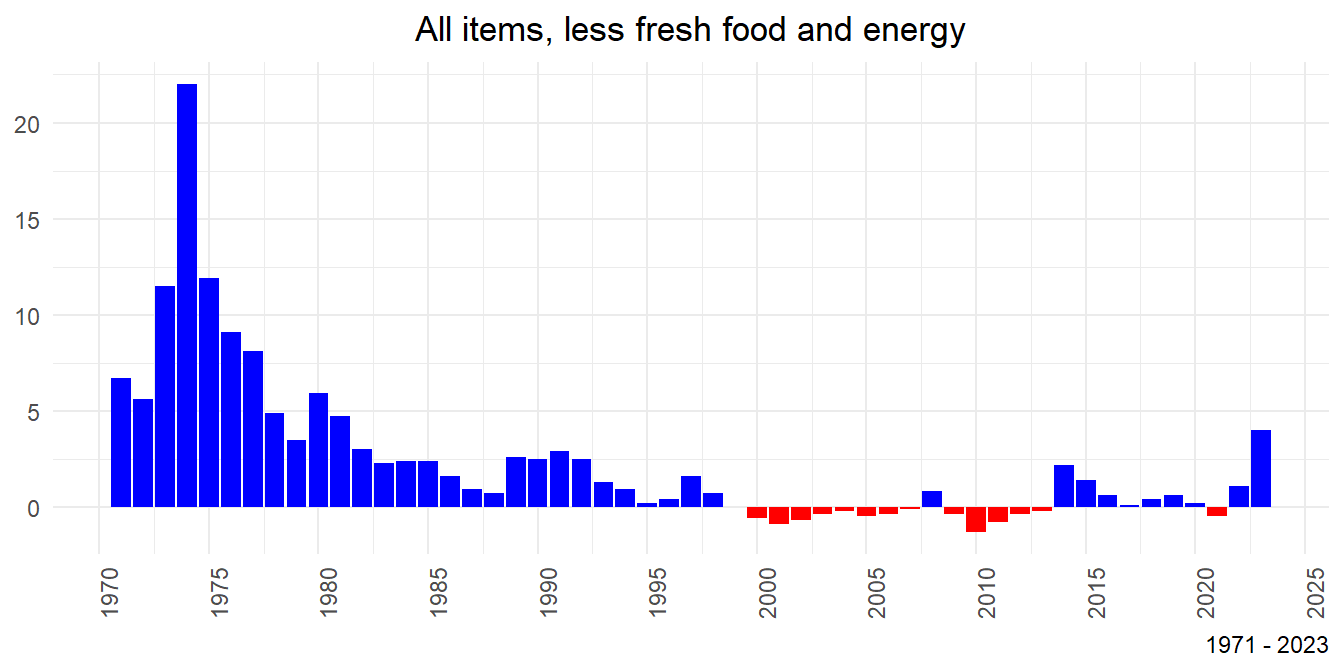
All items, less fresh food and energy
4.0
1.1
-0.5
0.2
0.6
0.4
0.1
0.6
1.4
2.2
All items, less food (less alcoholic beverages) and energy
2.5
0.1
-0.8
-0.1
0.4
0.1
-0.1
0.3
1.0
1.8
Table 2: All items,All items, less fresh food,All items, less imputed rent
Year
All items
All items, less fresh food
All items, less imputed rent
2023
3.2
3.1
3.8
2022
2.5
2.3
3.0
2021
-0.2
-0.2
-0.3
2020
0.0
-0.2
0.0
2019
0.5
0.6
0.6
2018
1.0
0.9
1.2
2017
0.5
0.5
0.6
2016
-0.1
-0.3
-0.1
2015
0.8
0.5
1.0
2014
2.7
2.6
3.3
2013
0.4
0.4
0.5
2012
0.0
-0.1
0.0
2011
-0.3
-0.3
-0.3
2010
-0.7
-1.0
-0.8
2009
-1.4
-1.3
-1.5
2008
1.4
1.5
1.6
2007
0.0
0.0
0.1
2006
0.3
0.1
0.3
2005
-0.3
-0.1
-0.4
2004
0.0
-0.1
0.0
2003
-0.3
-0.3
-0.3
2002
-0.9
-0.9
-1.1
2001
-0.7
-0.8
-0.9
2000
-0.7
-0.4
-0.9
1999
-0.3
0.0
-0.4
1998
0.6
0.3
0.7
1997
1.8
1.7
1.6
1996
0.1
0.2
0.0
1995
-0.1
0.0
-0.3
1994
0.7
0.8
0.5
1993
1.3
1.3
1.1
1992
1.6
2.2
1.6
1991
3.3
2.9
3.3
1990
3.1
2.7
3.1
1989
2.3
2.4
2.3
1988
0.7
0.4
0.5
1987
0.1
0.3
-0.2
1986
0.6
0.8
0.4
1985
2.0
2.0
2.1
1984
2.3
2.1
2.2
1983
1.9
1.9
1.9
1982
2.8
3.1
2.7
1981
4.9
4.8
4.9
1980
7.7
7.5
8.0
1979
3.7
3.7
3.6
1978
4.2
4.4
3.8
1977
8.1
8.1
8.1
1976
9.4
9.0
9.3
1975
11.7
11.9
11.8
1974
23.2
22.5
24.5
1973
11.7
11.4
11.7
1972
4.9
5.3
4.5
1971
6.3
6.6
6.1
Table 3: All items, less imputed rent & fresh food,All items, less fresh food and energy,All items, less food (less alcoholic beverages) and energy
Year
All items, less imputed rent & fresh food
All items, less fresh food and energy
All items, less food (less alcoholic beverages) and energy
2023
3.6
4.0
2.5
2022
2.7
1.1
0.1
2021
-0.3
-0.5
-0.8
2020
-0.2
0.2
-0.1
2019
0.8
0.6
0.4
2018
1.1
0.4
0.1
2017
0.7
0.1
-0.1
2016
-0.3
0.6
0.3
2015
0.7
1.4
1.0
2014
3.2
2.2
1.8
2013
0.5
-0.2
-0.2
2012
0.0
-0.4
-0.6
2011
-0.3
-0.8
-1.0
2010
-1.1
-1.3
-1.2
2009
-1.5
-0.4
-0.7
2008
1.7
0.8
0.0
2007
0.1
-0.1
-0.3
2006
0.1
-0.4
-0.4
2005
-0.1
-0.5
-0.4
2004
-0.2
-0.2
-0.6
2003
-0.4
-0.4
-0.3
2002
-1.0
-0.7
-0.8
2001
-1.0
-0.9
-0.9
2000
-0.5
-0.6
-0.4
1999
-0.2
0.0
-0.1
1998
0.3
0.7
0.7
1997
1.8
1.6
1.6
1996
-0.1
0.4
0.5
1995
-0.3
0.2
0.7
1994
0.6
0.9
0.8
1993
1.2
1.3
1.4
1992
2.1
2.5
2.5
1991
2.9
2.9
2.6
1990
2.6
2.5
2.6
1989
2.3
2.6
2.5
1988
0.3
0.7
1.1
1987
0.0
0.9
1.5
1986
0.6
1.6
1.9
1985
2.0
2.4
2.7
1984
2.2
2.4
2.6
1983
1.8
2.3
2.5
1982
2.9
3.0
3.2
1981
4.9
4.7
4.6
1980
7.8
5.9
6.5
1979
3.5
3.5
4.4
1978
4.0
4.9
5.4
1977
8.0
8.1
8.9
1976
8.8
9.1
9.8
1975
12.0
11.9
10.7
1974
23.8
22.0
19.4
1973
11.4
11.5
10.9
1972
5.0
5.6
5.6
1971
6.4
6.7
6.7
Figure 1: All items
Figure 2: All items, less fresh food
Figure 3: All items, less imputed rent
Figure 4: All items, less imputed rent & fresh food
Figure 5: All items, less fresh food and energy
Figure 6: All items, less food (less alcoholic beverages) and energy
Source
Dataset:2020-Base Consumer Price Index
Publisher:Ministry of Internal Affairs and Communications
Last modified
Sys.time()
[1] "2024-02-21 16:17:04 JST"
Version
R.Version()$version.string
[1] "R version 4.3.2 Patched (2023-12-27 r85754 ucrt)"
Figure 1: All itemsFigure 2: All items, less fresh foodFigure 3: All items, less imputed rentFigure 4: All items, less imputed rent & fresh foodFigure 5: All items, less fresh food and energyFigure 6: All items, less food (less alcoholic beverages) and energy