Which Nationality Has The Largest Number Of Foreigners Living In Japan?
1 The answer is…
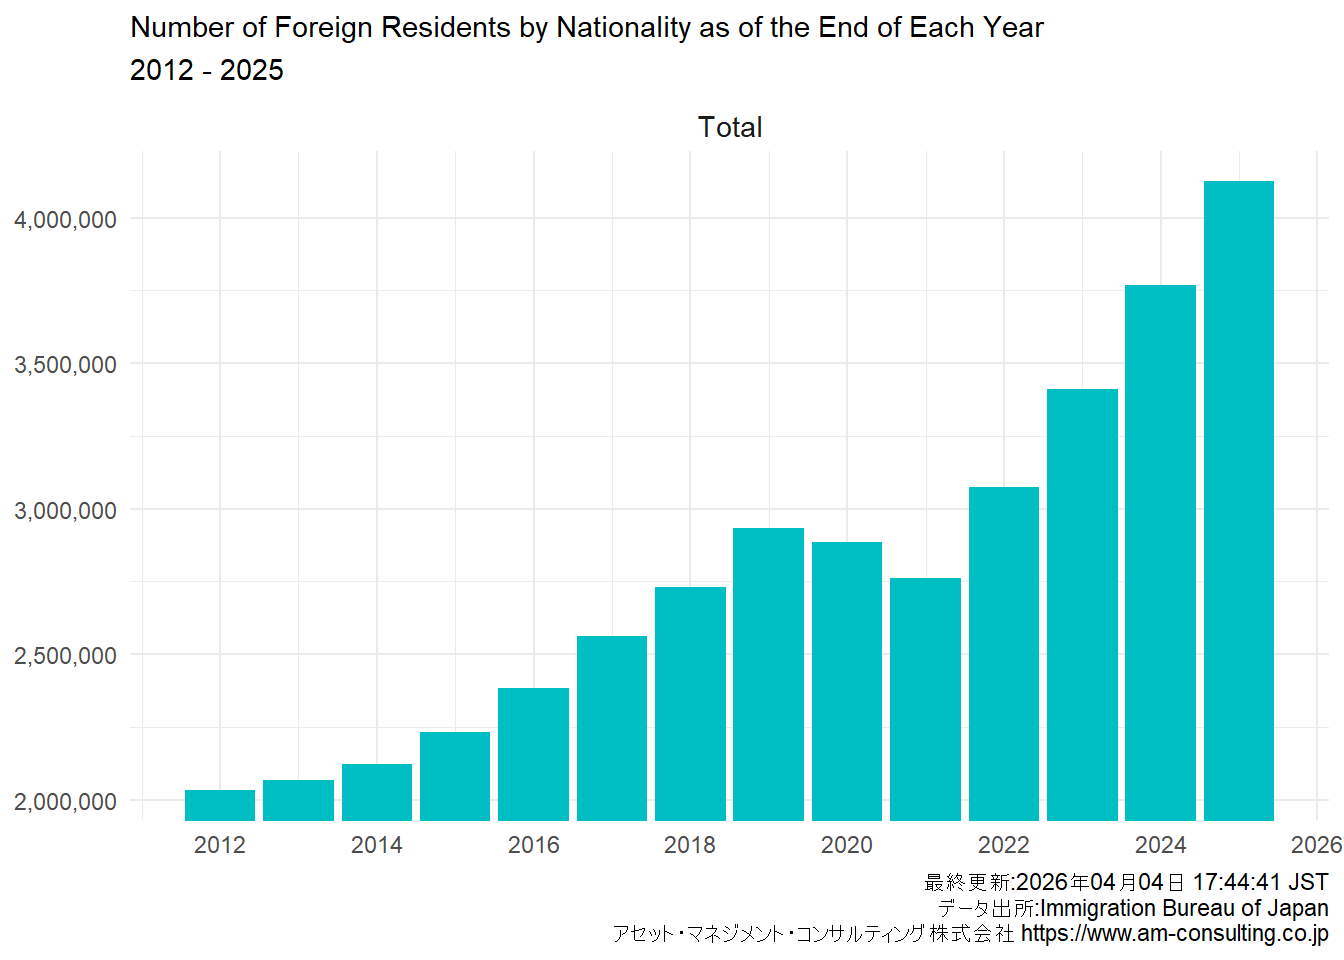
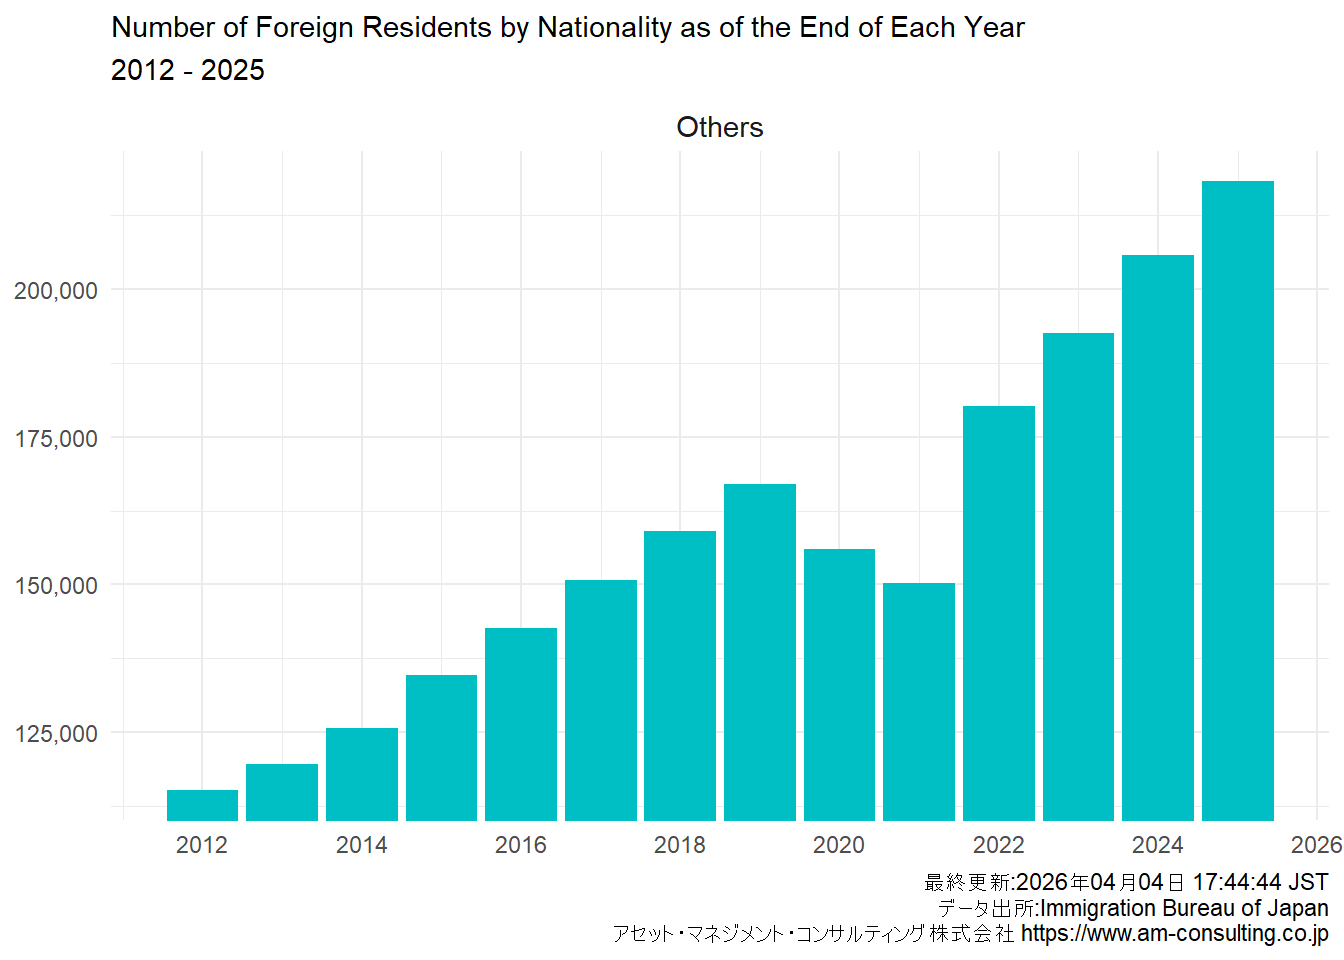
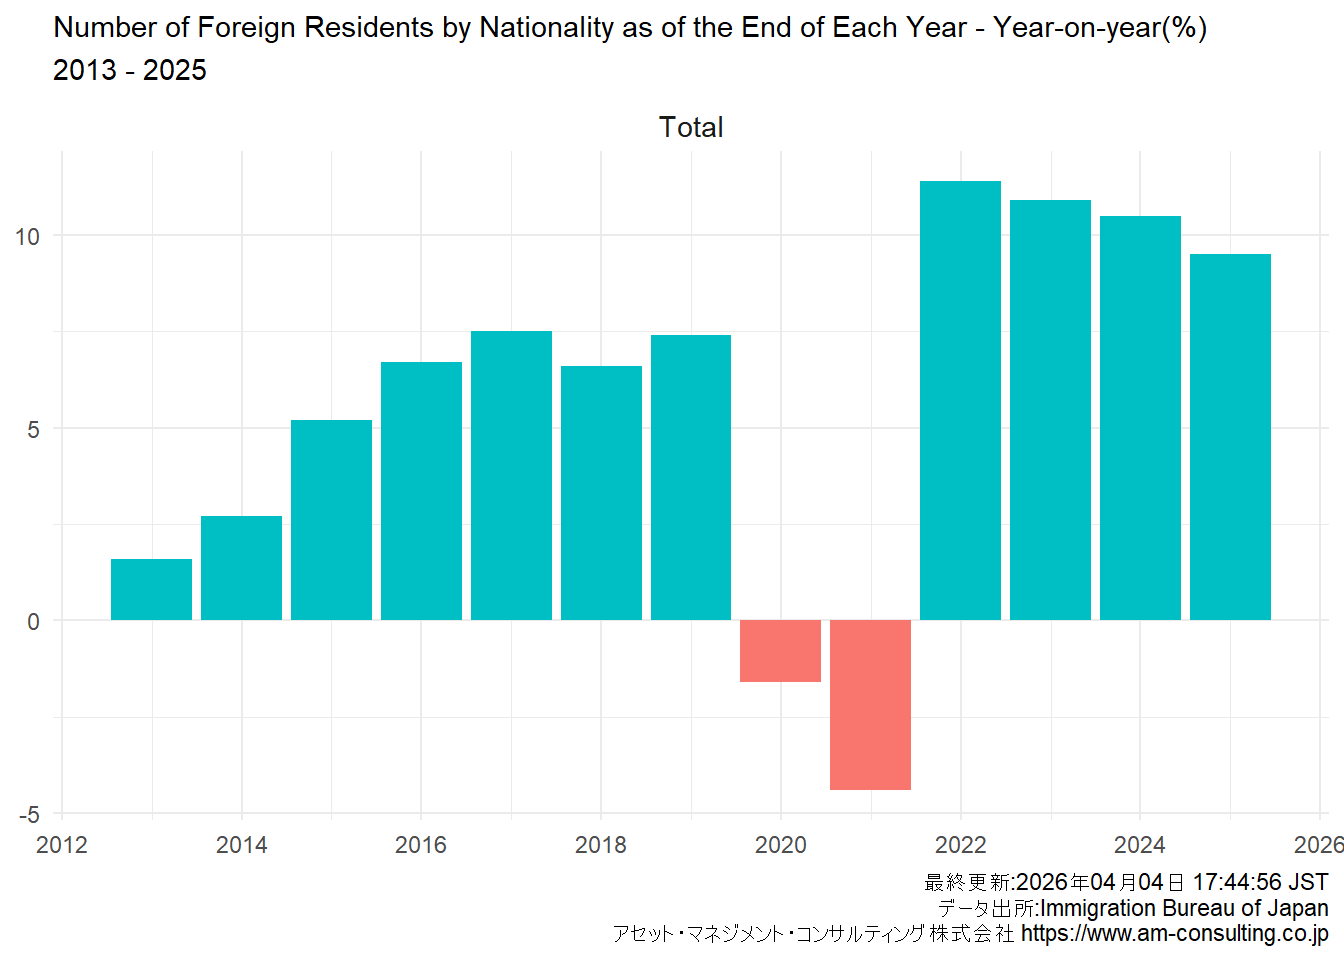
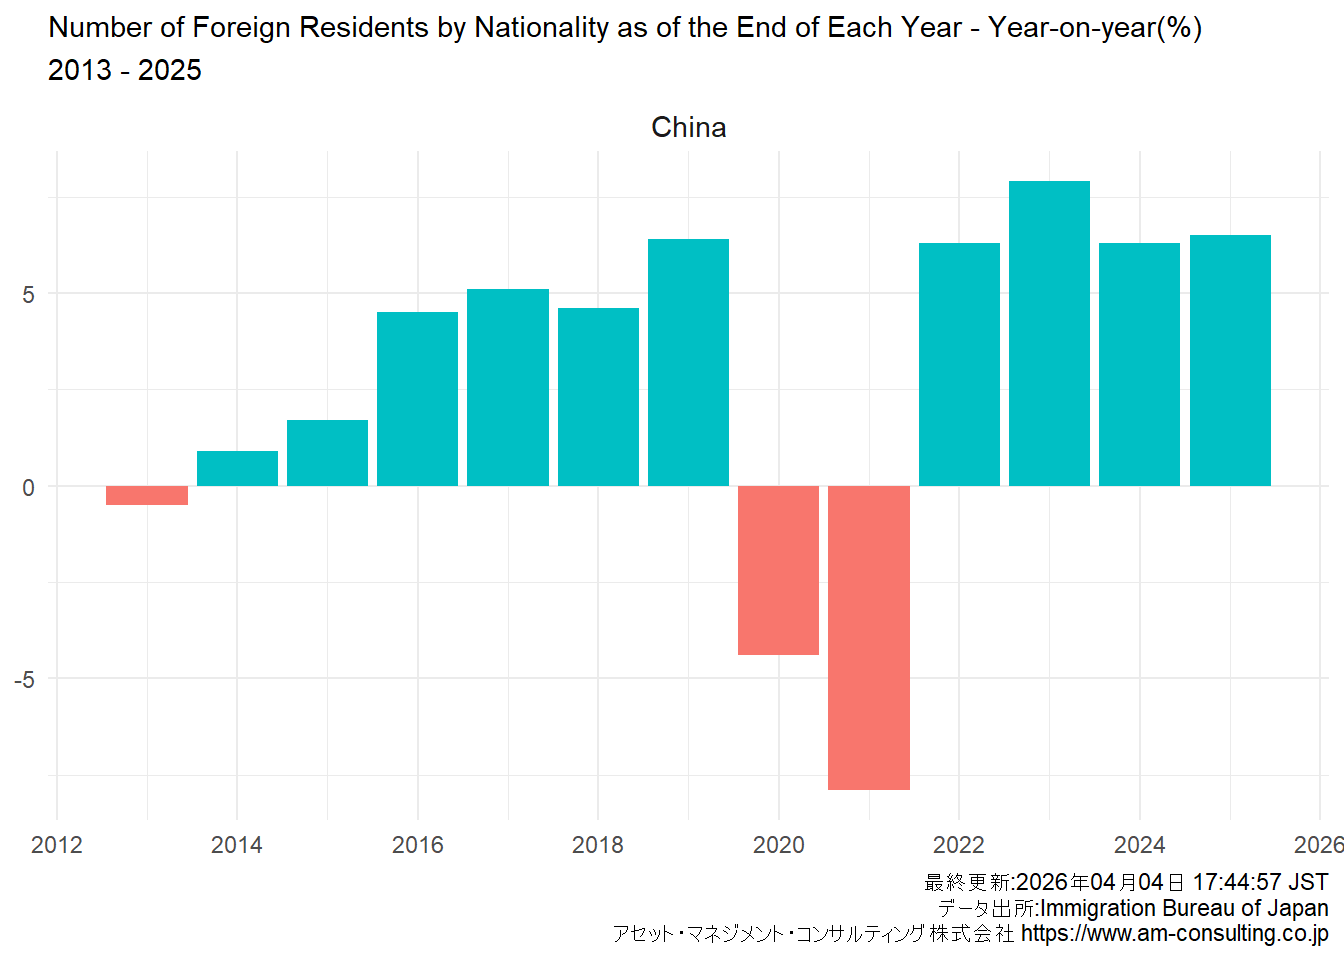
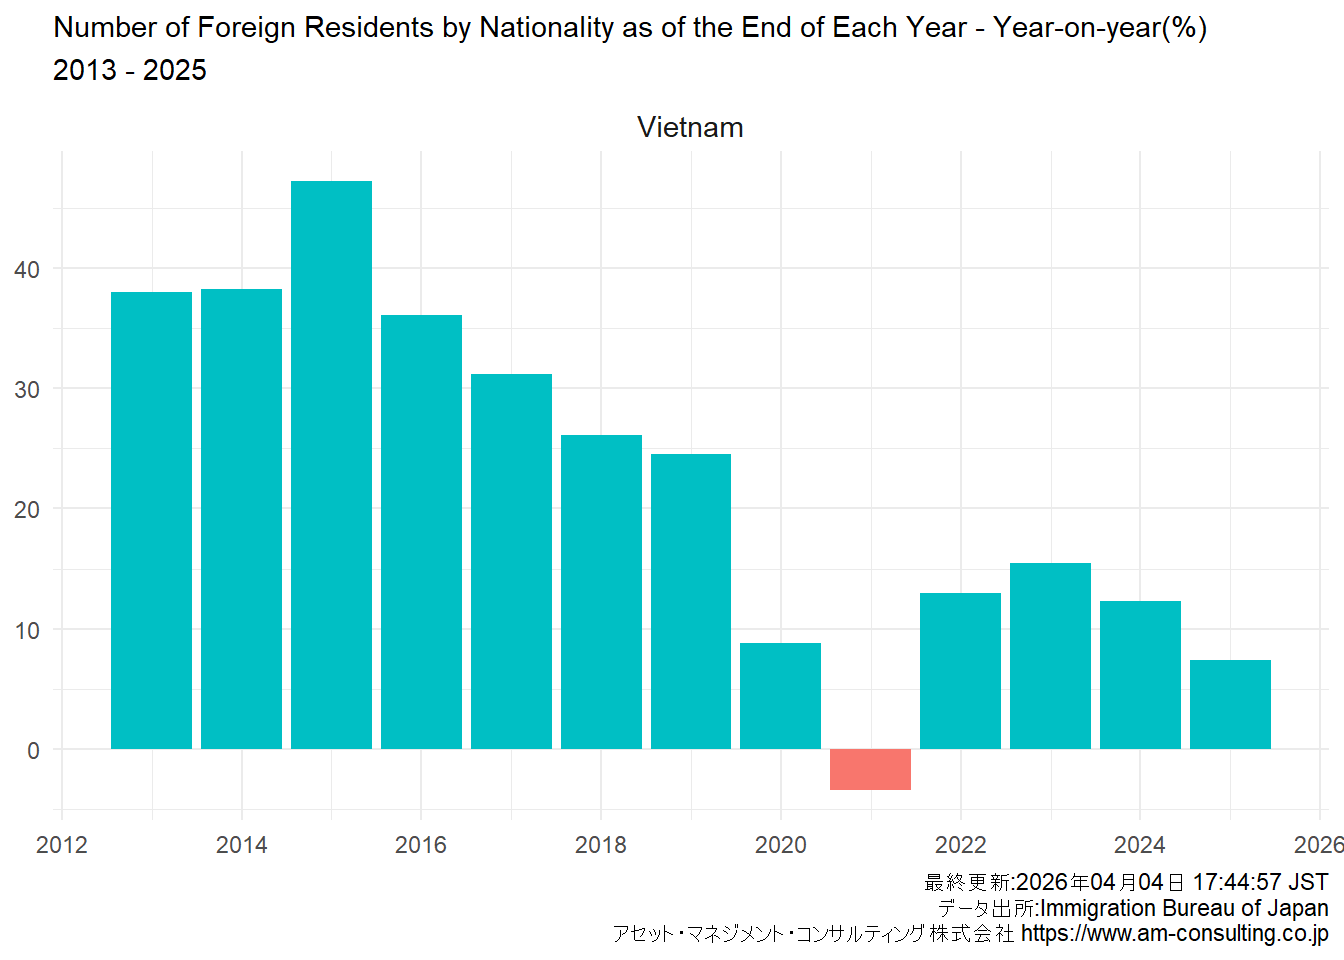
1.1 Number of Foreign Residents by Nationality as of the End of Each Year
1.1.1 Number
1.1.1.1 Time series table
| No | 系列 | 2025 | 2024 | 2023 | 2022 | 2021 | 2020 | 2019 | 2018 | 2017 | 2016 | 2015 | 2014 | 2013 | 2012 |
|---|---|---|---|---|---|---|---|---|---|---|---|---|---|---|---|
| 1 | Total | 4,125,395 | 3,768,977 | 3,410,992 | 3,075,213 | 2,760,635 | 2,887,116 | 2,933,137 | 2,731,093 | 2,561,848 | 2,382,822 | 2,232,189 | 2,121,831 | 2,066,445 | 2,033,656 |
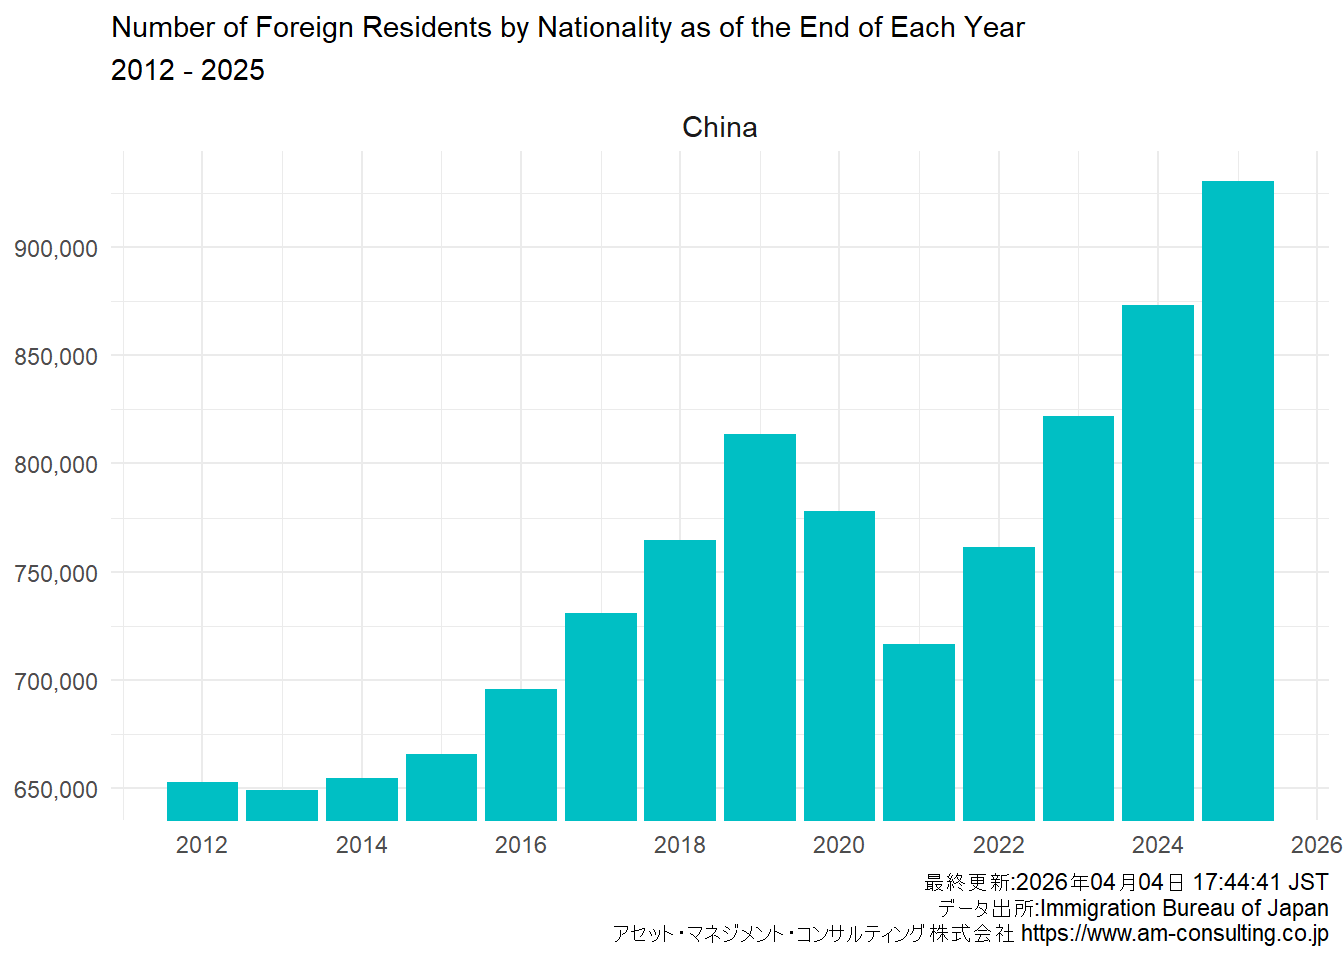
| 2 | China | 930,428 | 873,286 | 821,838 | 761,563 | 716,606 | 778,112 | 813,675 | 764,720 | 730,890 | 695,522 | 665,847 | 654,777 | 649,078 | 652,595 |
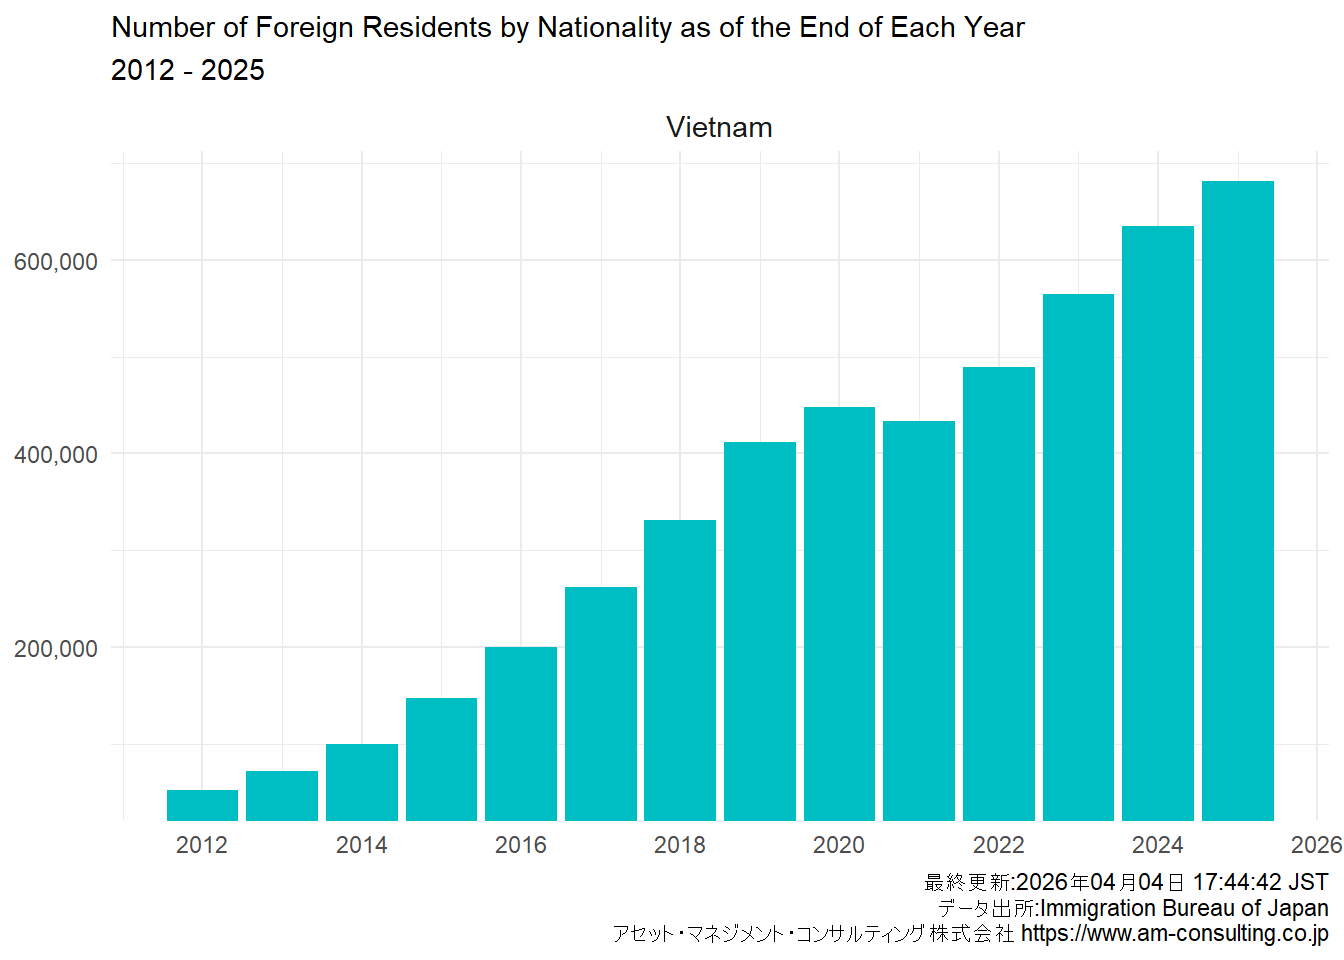
| 3 | Vietnam | 681,100 | 634,361 | 565,026 | 489,312 | 432,934 | 448,053 | 411,968 | 330,835 | 262,405 | 199,990 | 146,956 | 99,865 | 72,256 | 52,367 |
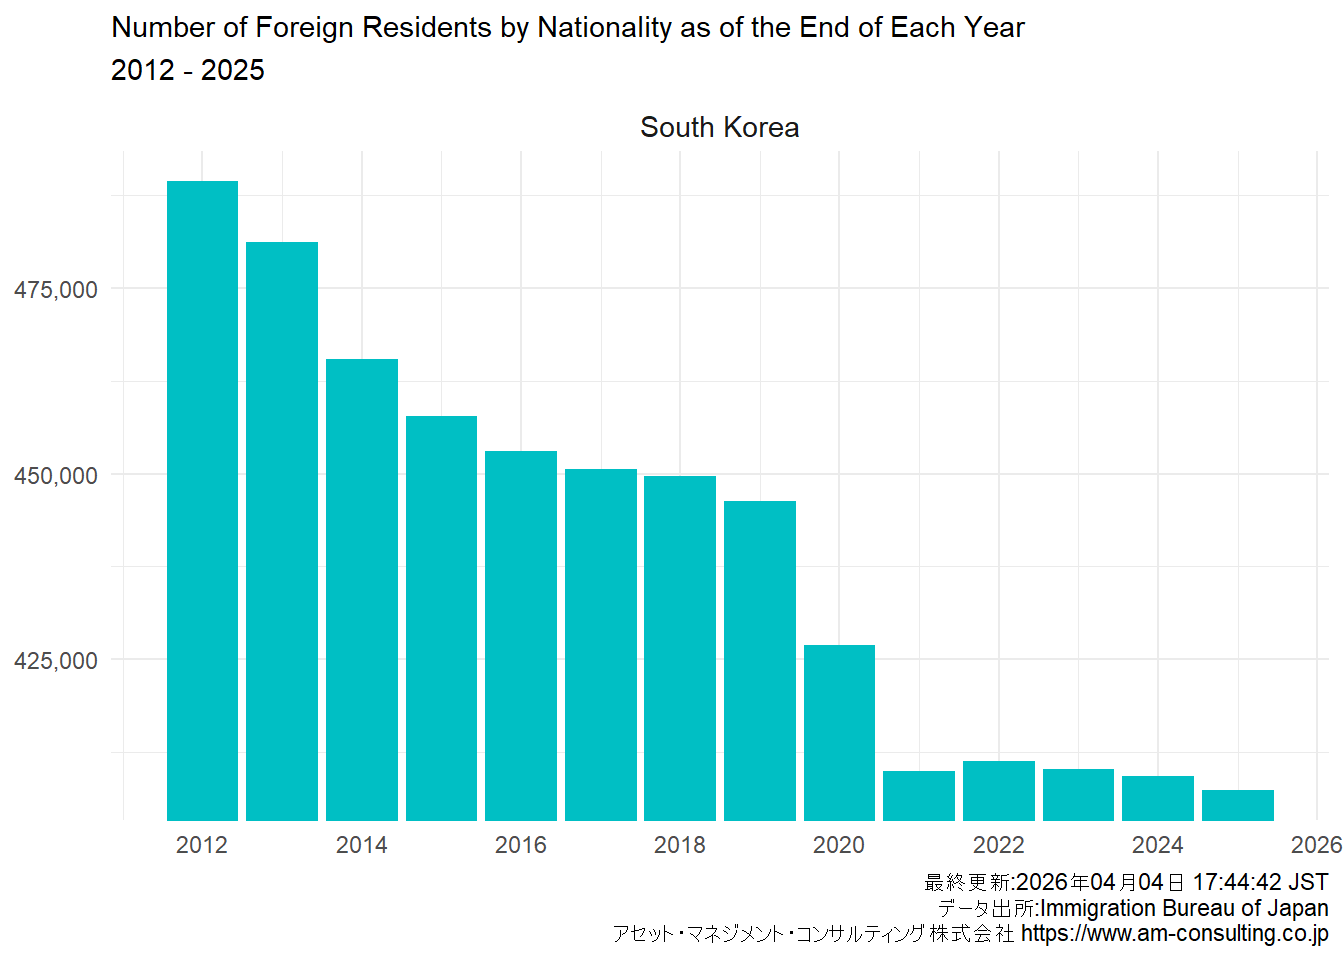
| 4 | South Korea | 407,341 | 409,238 | 410,156 | 411,312 | 409,855 | 426,908 | 446,364 | 449,634 | 450,663 | 453,096 | 457,772 | 465,477 | 481,249 | 489,431 |
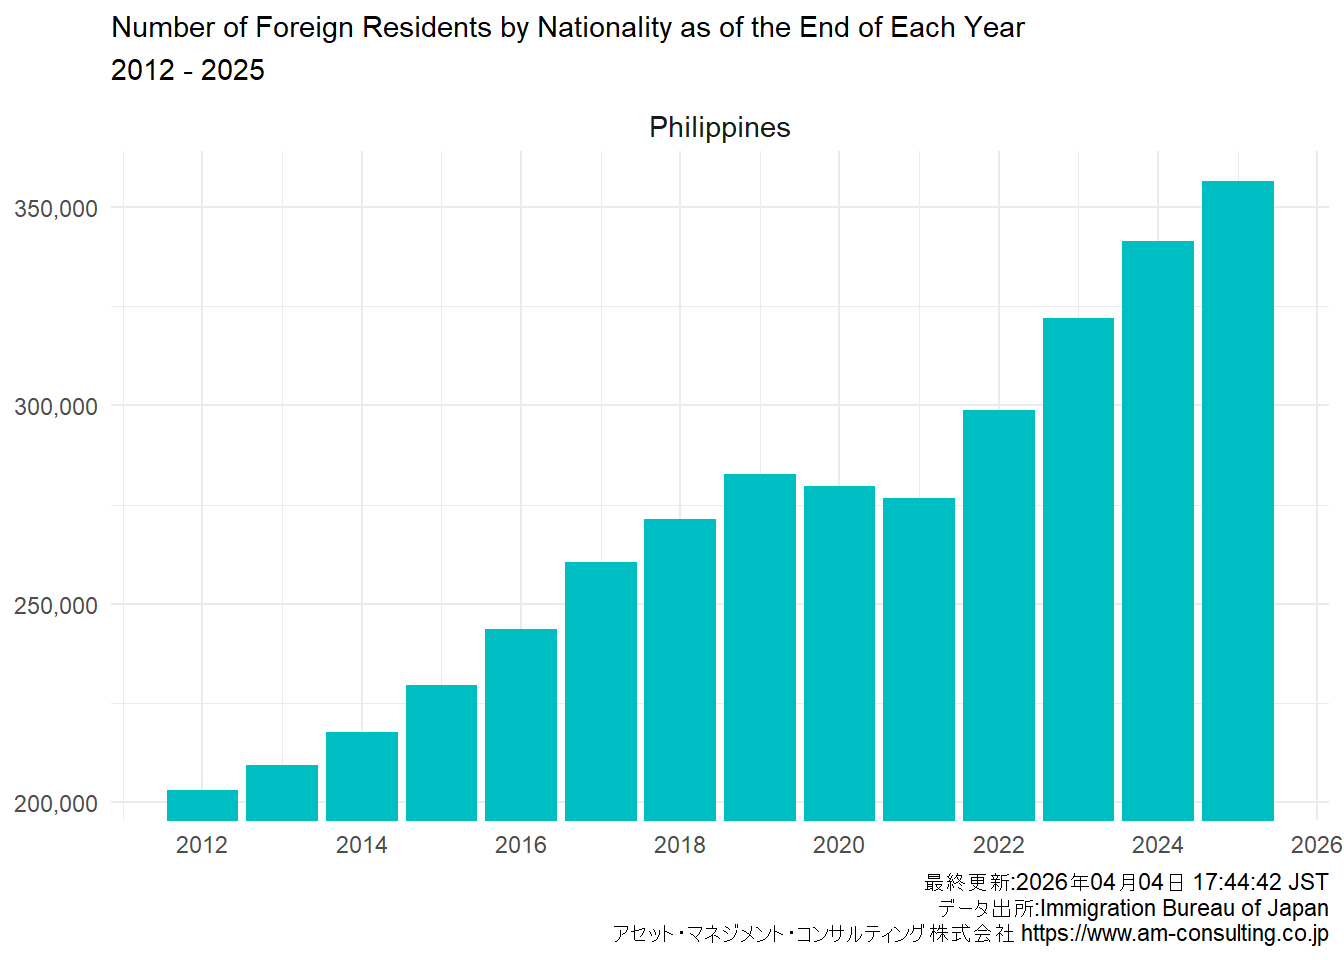
| 5 | Philippines | 356,579 | 341,518 | 322,046 | 298,740 | 276,615 | 279,660 | 282,798 | 271,289 | 260,553 | 243,662 | 229,595 | 217,585 | 209,183 | 202,985 |
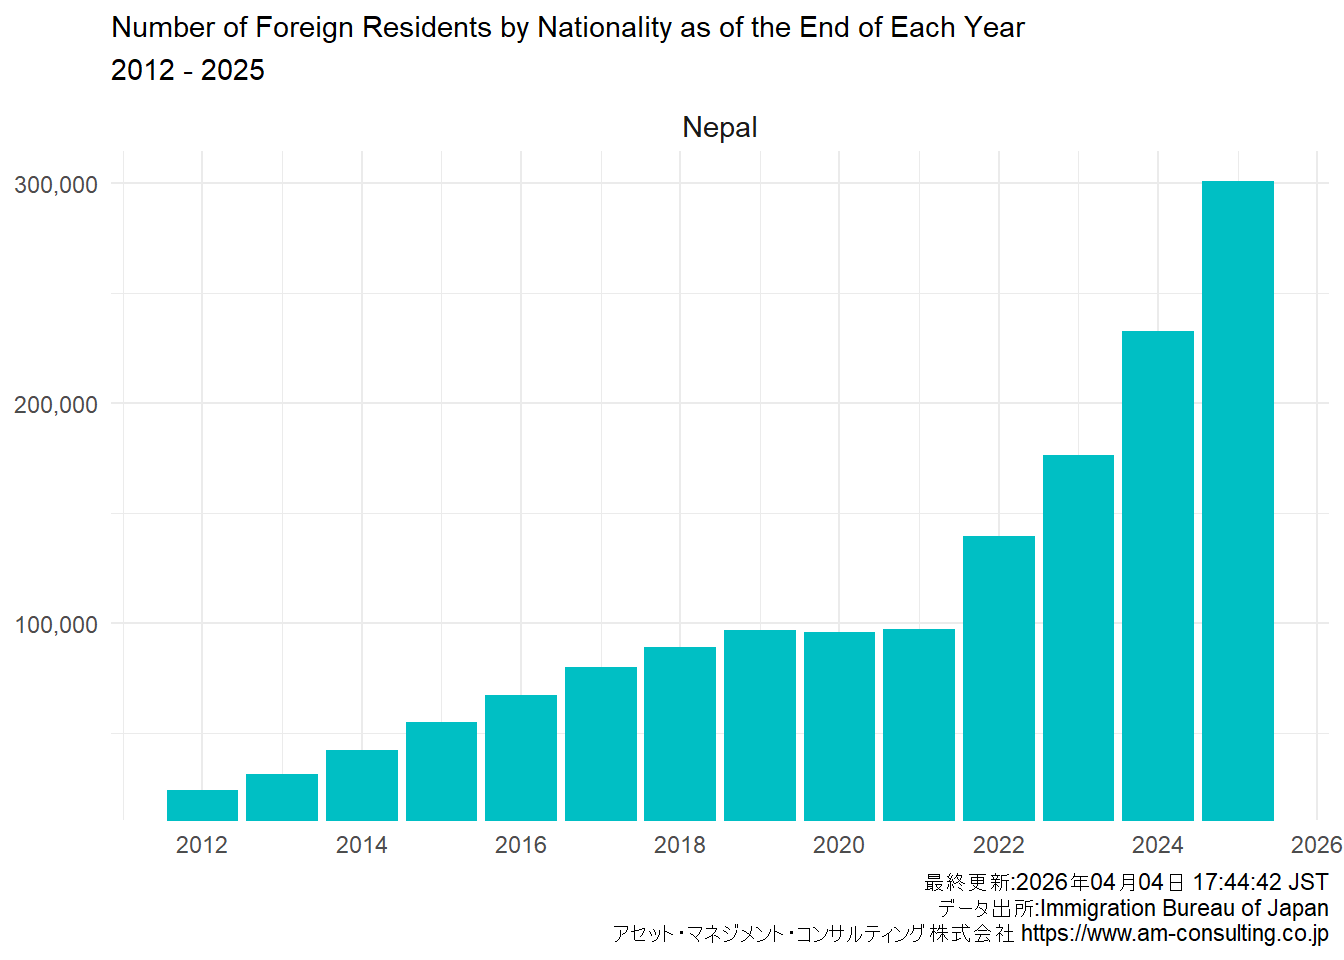
| 6 | Nepal | 300,992 | 233,043 | 176,336 | 139,393 | 97,109 | 95,982 | 96,824 | 88,951 | 80,038 | 67,470 | 54,775 | 42,346 | 31,537 | 24,071 |
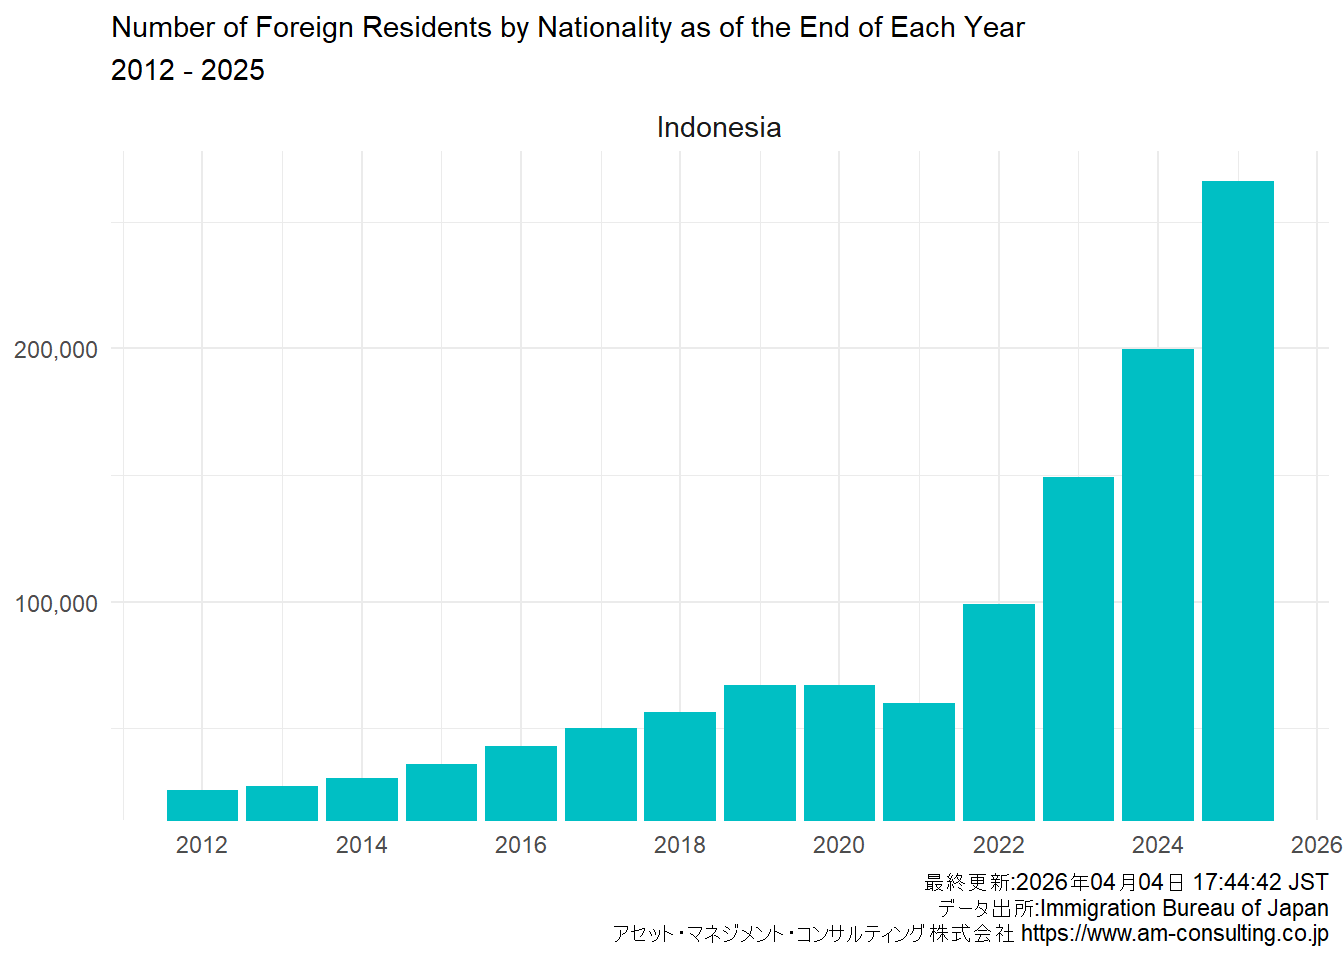
| 7 | Indonesia | 266,069 | 199,824 | 149,101 | 98,865 | 59,820 | 66,832 | 66,860 | 56,346 | 49,982 | 42,850 | 35,910 | 30,210 | 27,214 | 25,532 |
| 8 | Others | 218,224 | 205,745 | 192,613 | 180,167 | 150,265 | 156,032 | 166,988 | 158,962 | 150,676 | 142,617 | 134,661 | 125,788 | 119,596 | 115,224 |
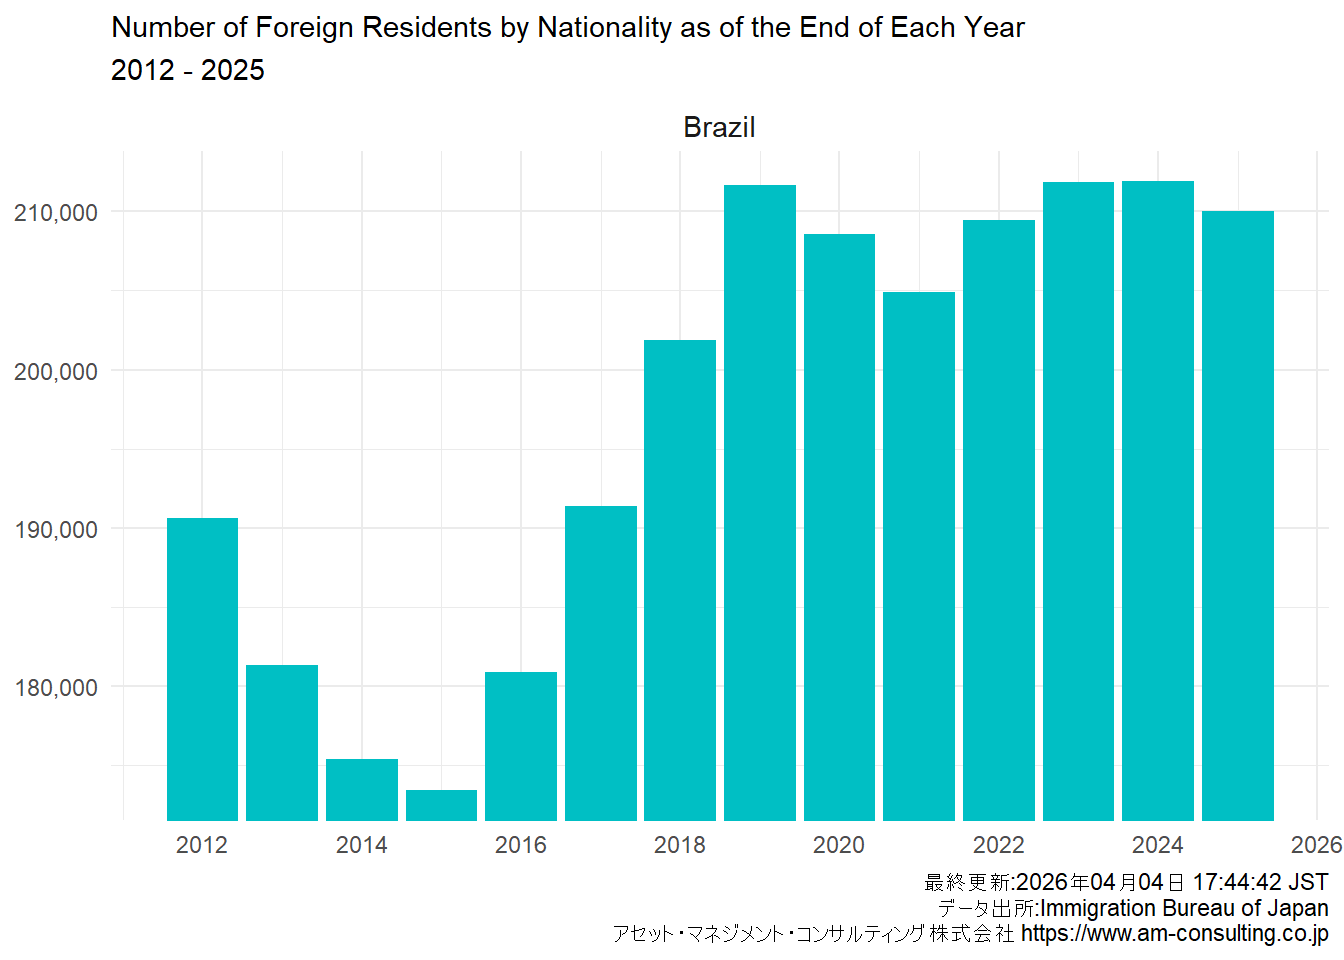
| 9 | Brazil | 210,014 | 211,907 | 211,840 | 209,430 | 204,879 | 208,538 | 211,677 | 201,865 | 191,362 | 180,923 | 173,437 | 175,410 | 181,317 | 190,609 |
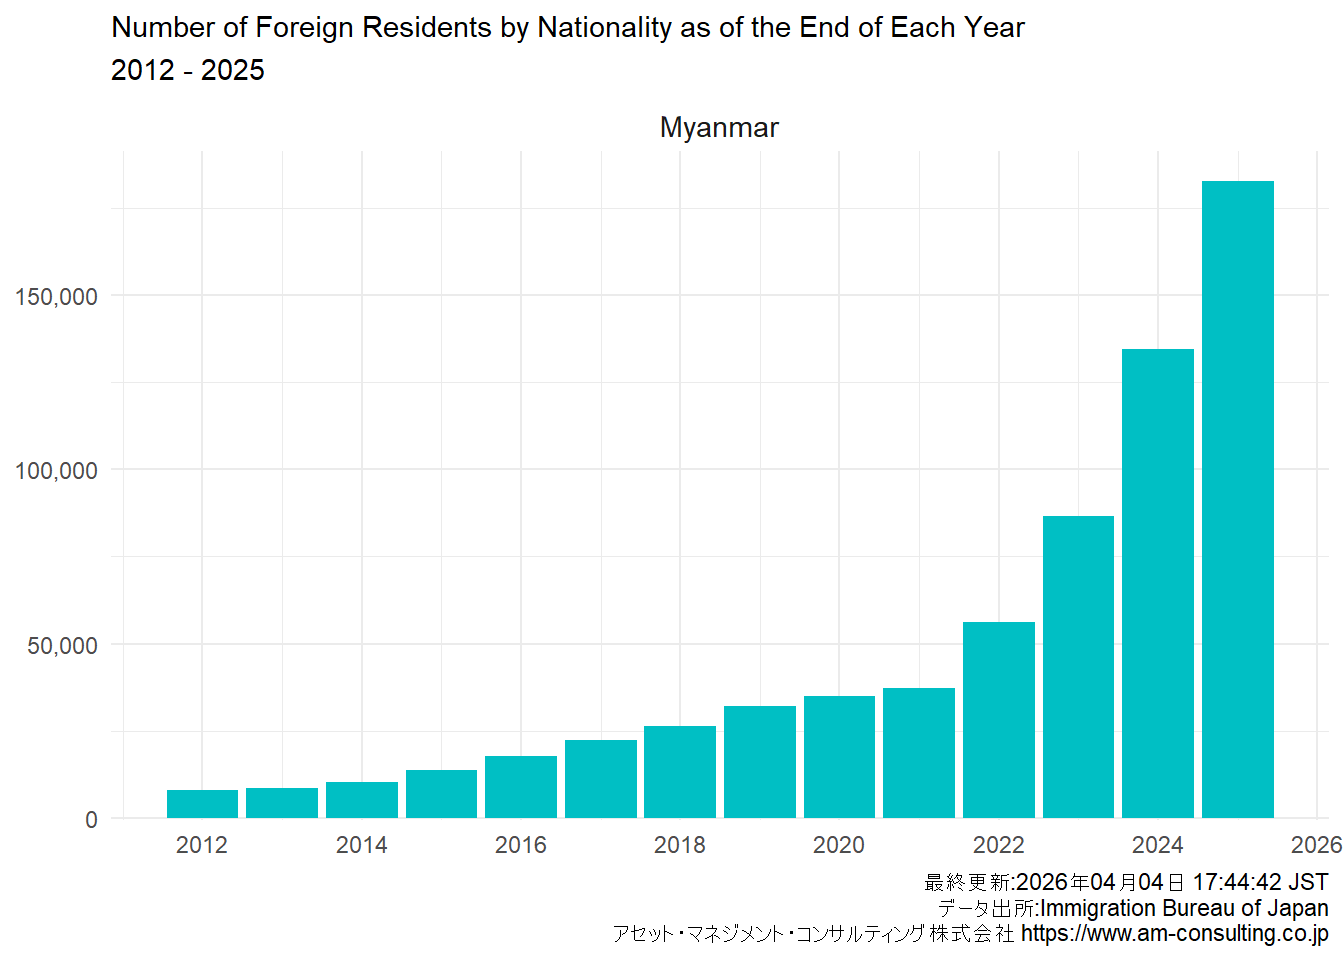
| 10 | Myanmar | 182,567 | 134,574 | 86,546 | 56,239 | 37,246 | 35,049 | 32,049 | 26,456 | 22,519 | 17,775 | 13,737 | 10,252 | 8,600 | 8,046 |
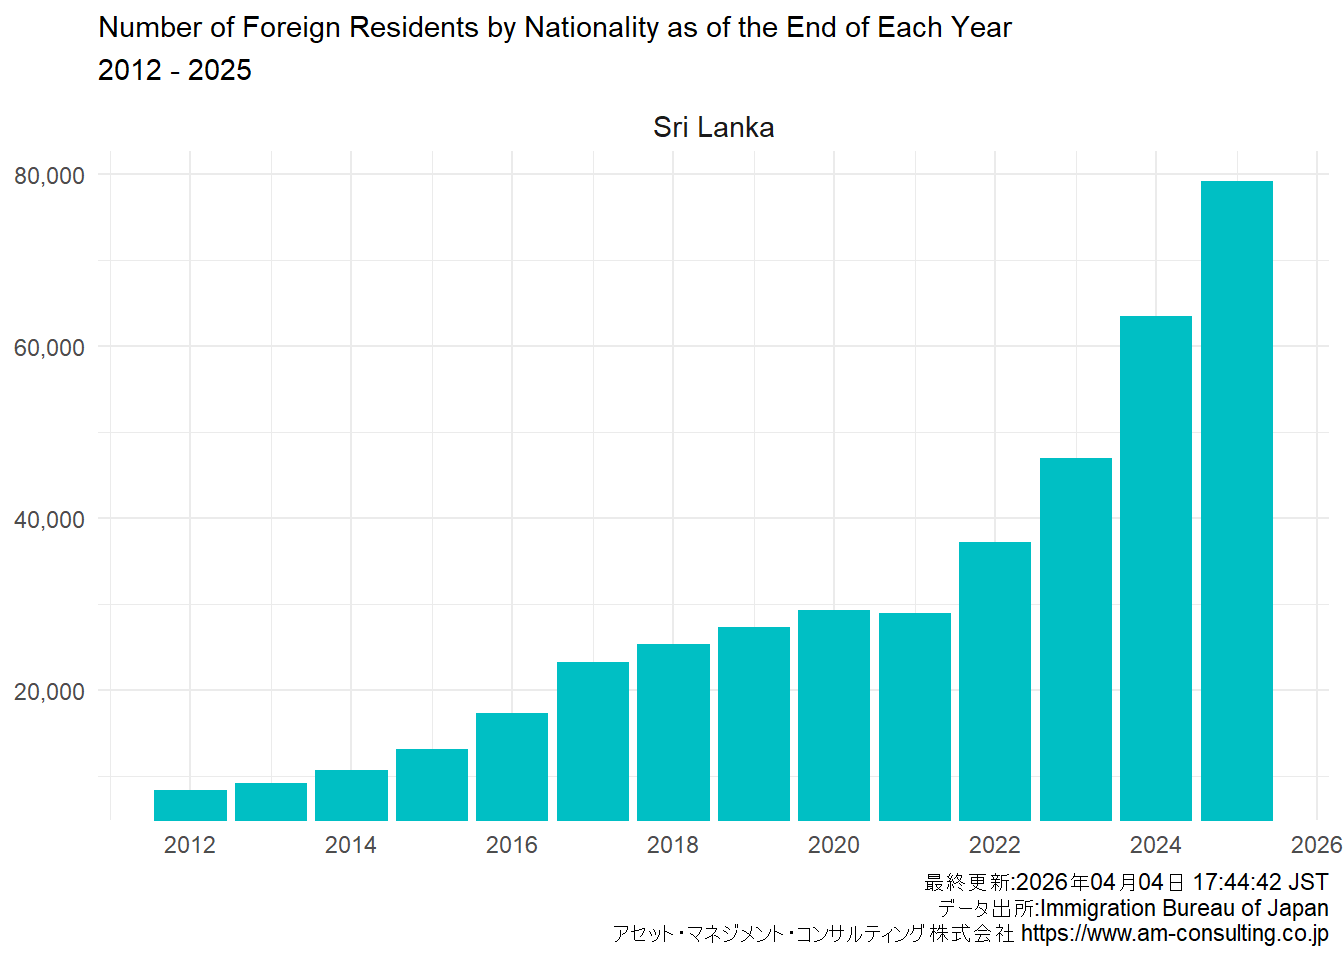
| 11 | Sri Lanka | 79,128 | 63,472 | 46,949 | 37,251 | 28,986 | 29,290 | 27,367 | 25,410 | 23,348 | 17,346 | 13,152 | 10,741 | 9,193 | 8,428 |
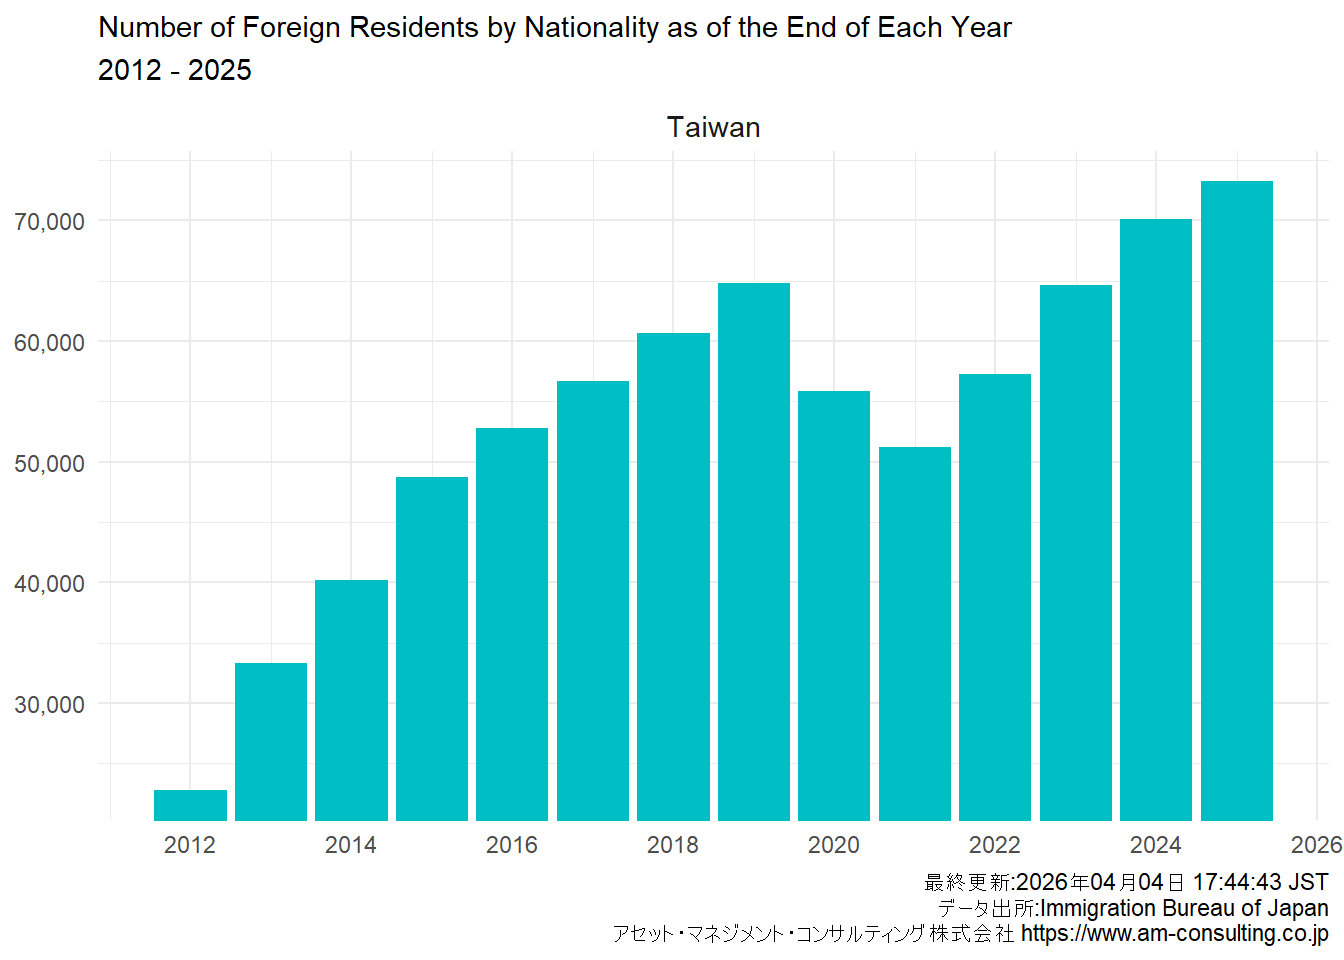
| 12 | Taiwan | 73,256 | 70,147 | 64,663 | 57,294 | 51,191 | 55,872 | 64,773 | 60,684 | 56,724 | 52,768 | 48,723 | 40,197 | 33,324 | 22,775 |
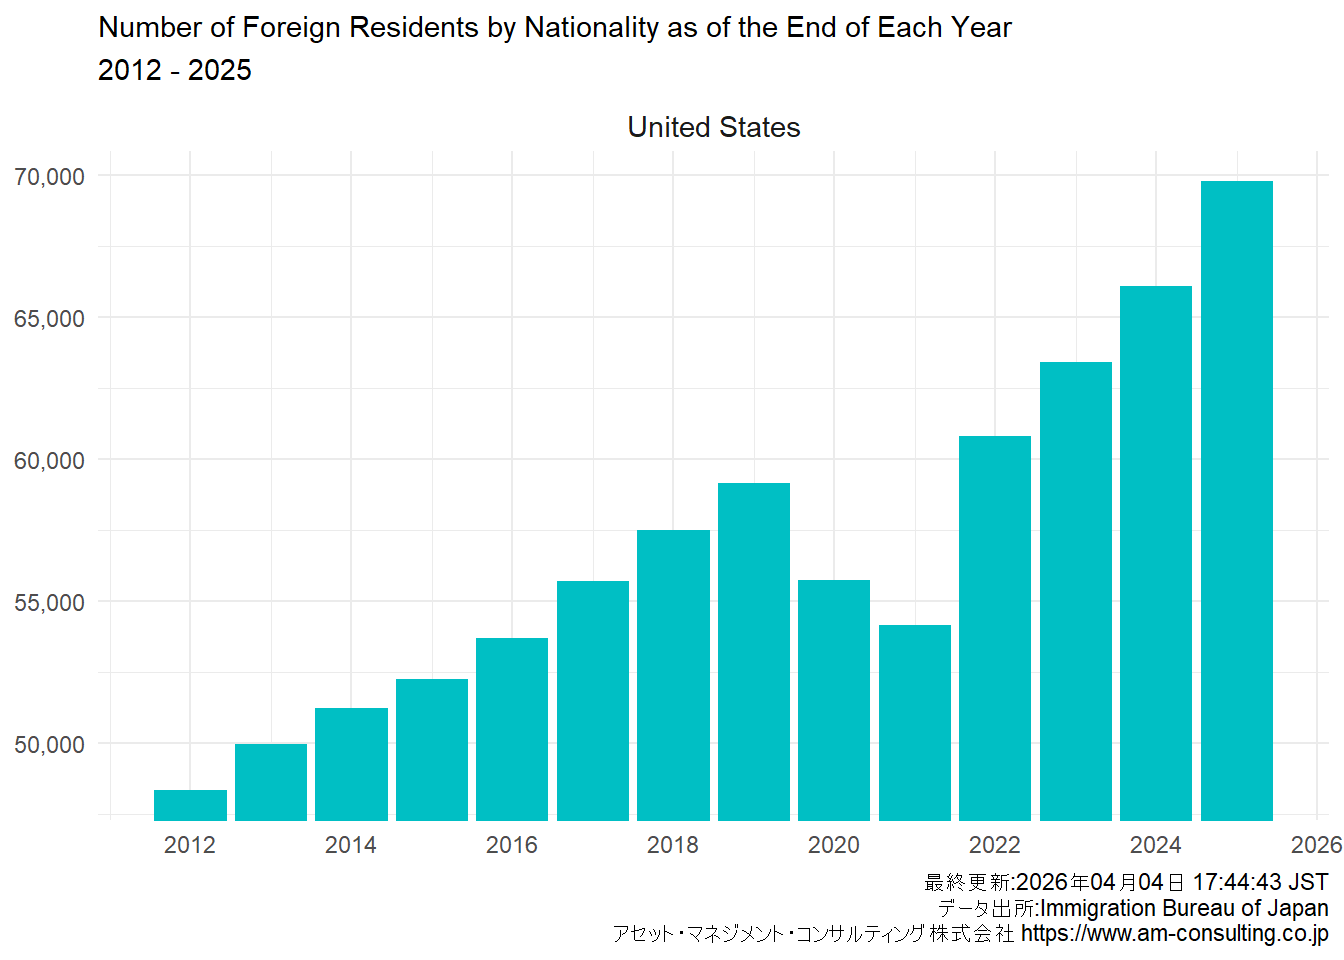
| 13 | United States | 69,787 | 66,111 | 63,408 | 60,804 | 54,162 | 55,761 | 59,172 | 57,500 | 55,713 | 53,705 | 52,271 | 51,256 | 49,981 | 48,361 |
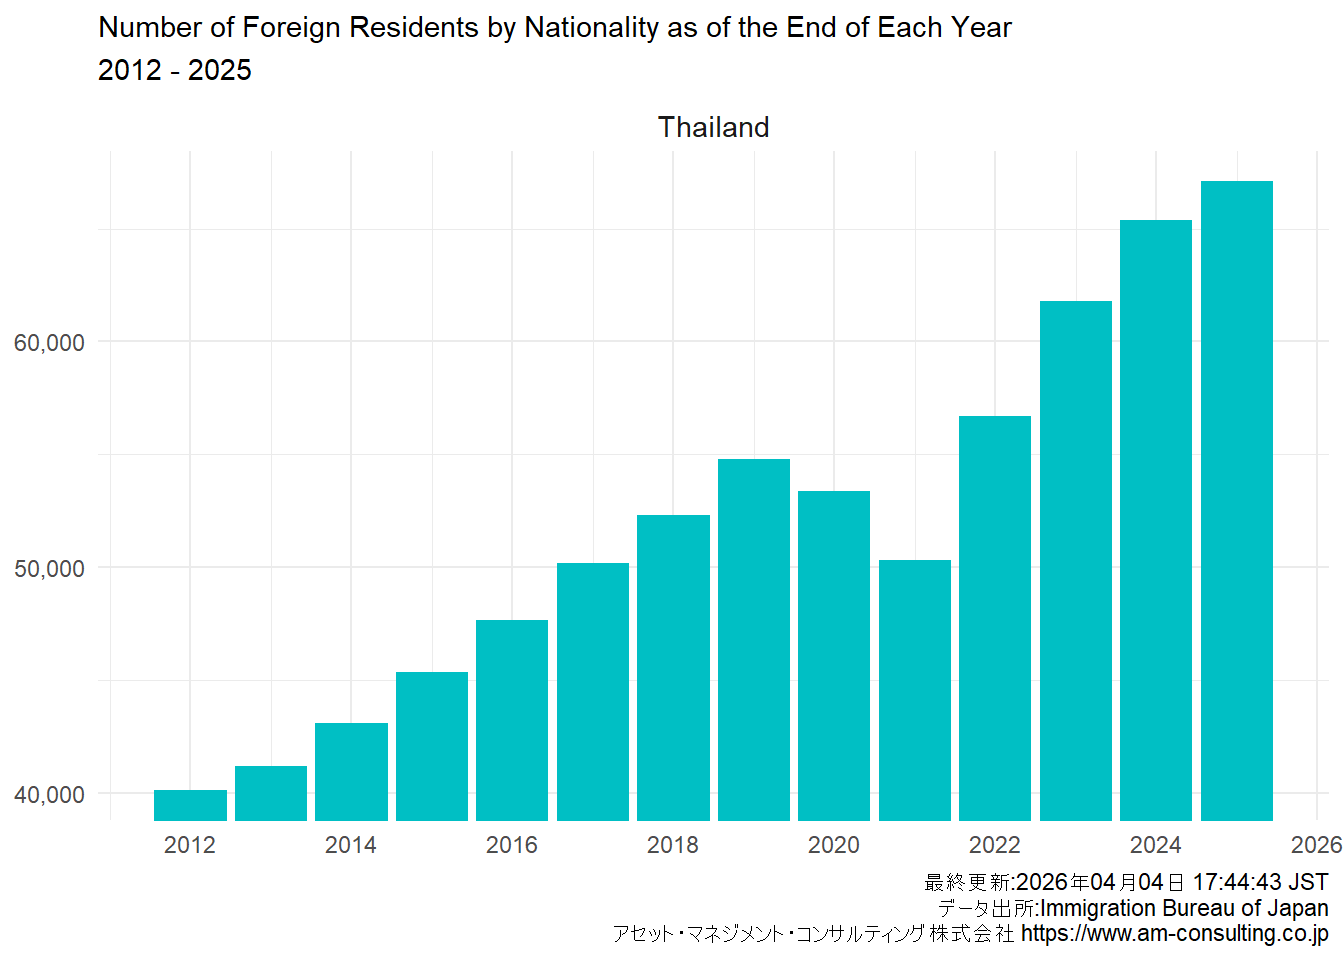
| 14 | Thailand | 67,097 | 65,398 | 61,771 | 56,701 | 50,324 | 53,379 | 54,809 | 52,323 | 50,179 | 47,647 | 45,379 | 43,081 | 41,208 | 40,133 |
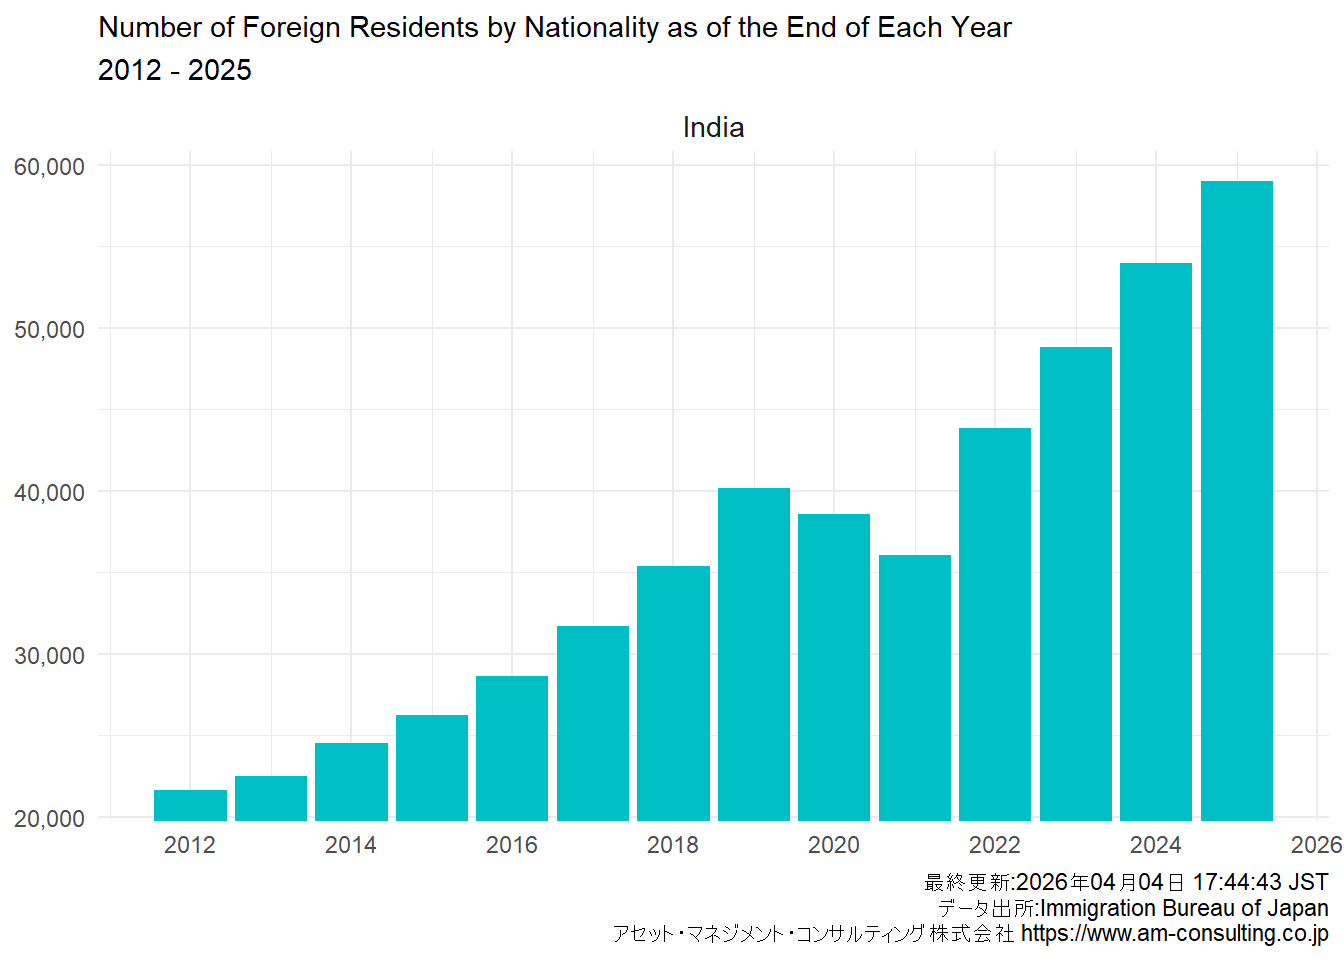
| 15 | India | 58,999 | 53,974 | 48,835 | 43,886 | 36,058 | 38,558 | 40,202 | 35,419 | 31,689 | 28,667 | 26,244 | 24,524 | 22,526 | 21,654 |
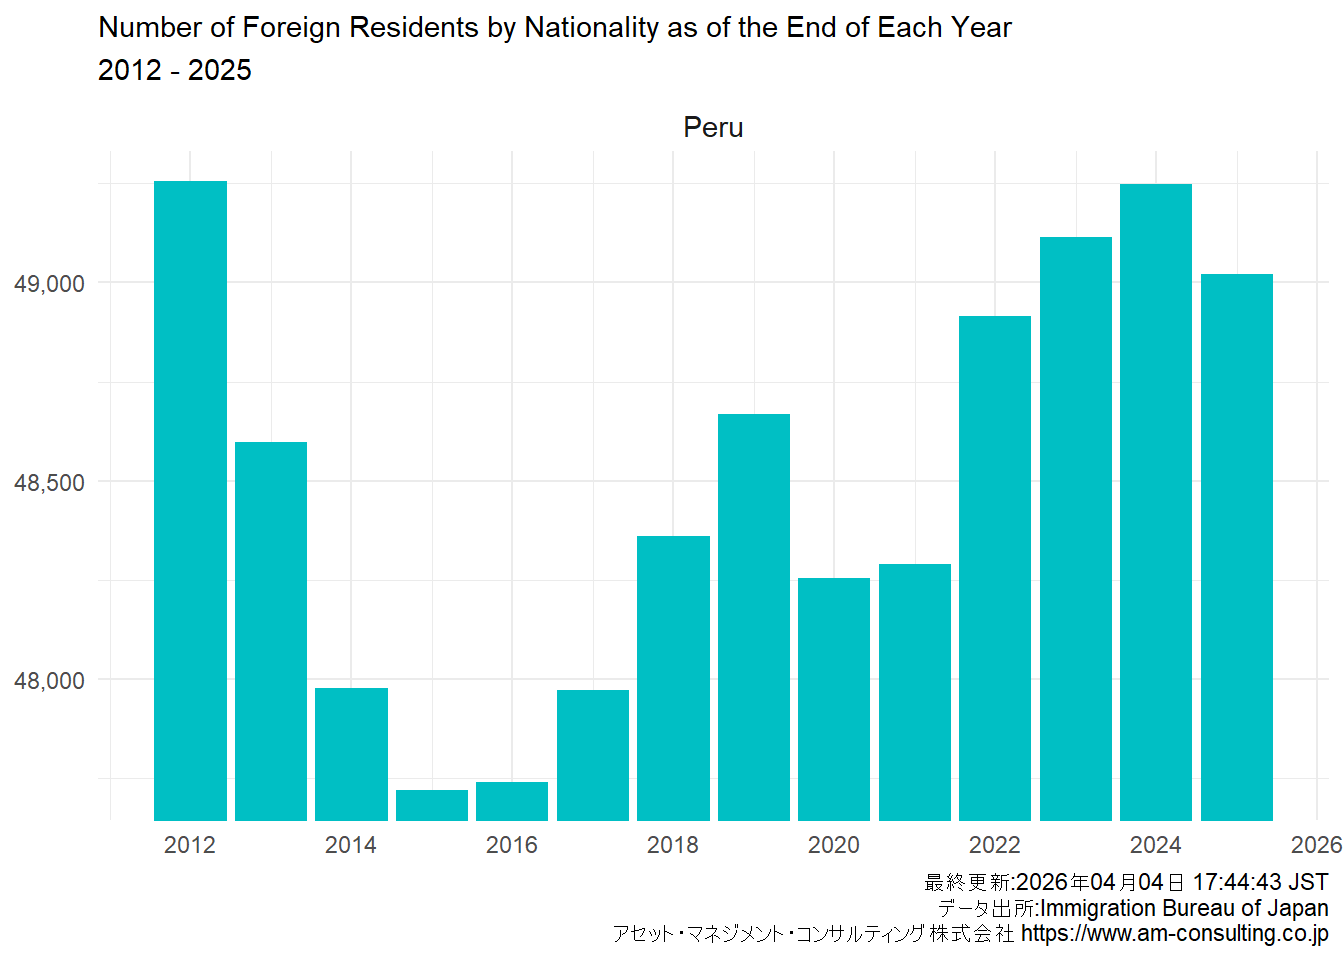
| 16 | Peru | 49,020 | 49,247 | 49,114 | 48,914 | 48,291 | 48,256 | 48,669 | 48,362 | 47,972 | 47,740 | 47,721 | 47,978 | 48,598 | 49,255 |
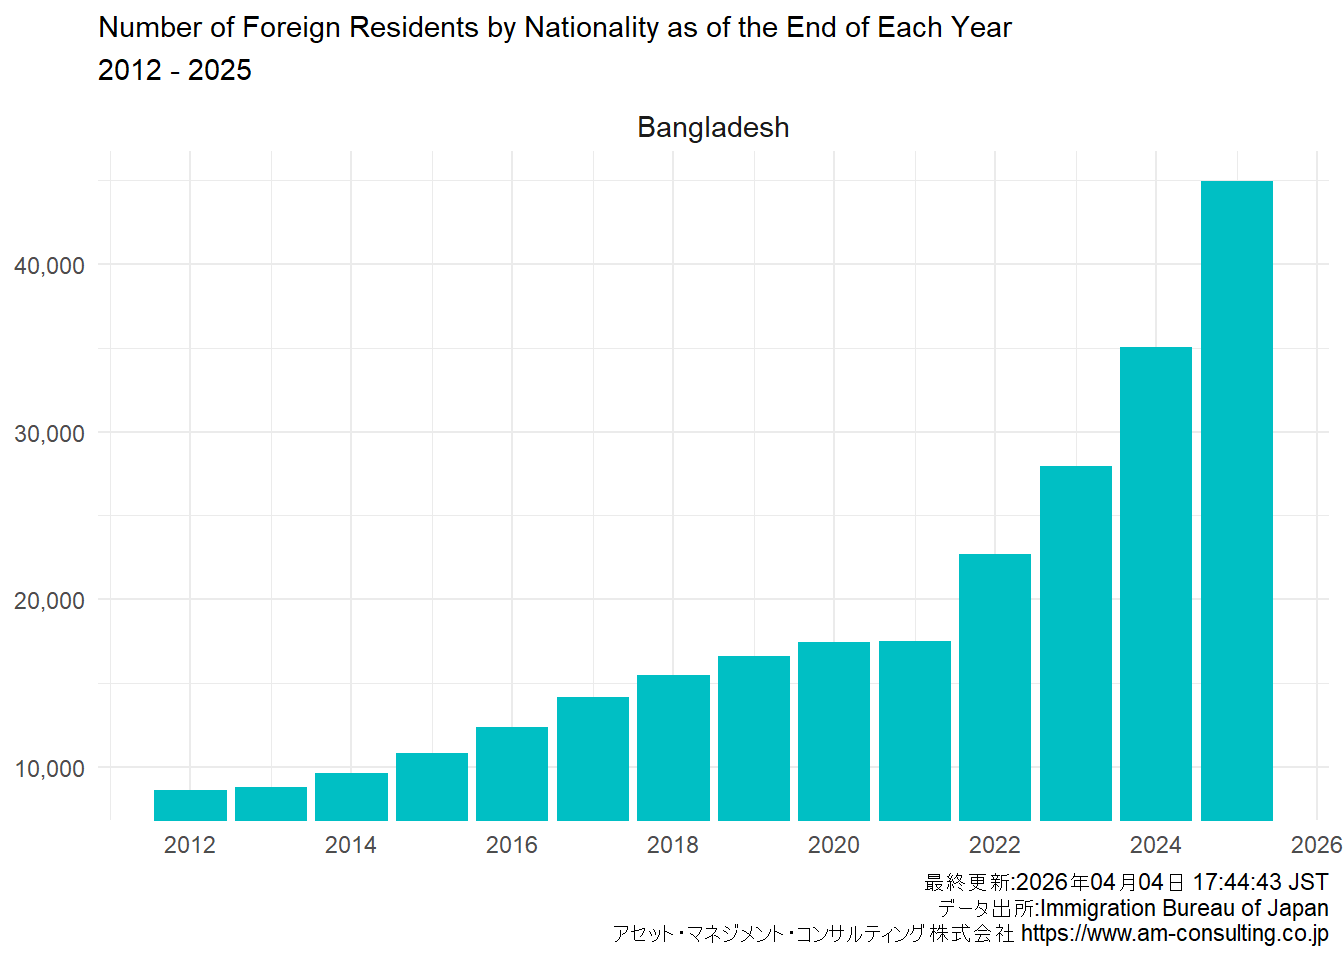
| 17 | Bangladesh | 44,938 | 35,073 | 27,962 | 22,723 | 17,538 | 17,463 | 16,632 | 15,476 | 14,144 | 12,374 | 10,835 | 9,641 | 8,824 | 8,622 |
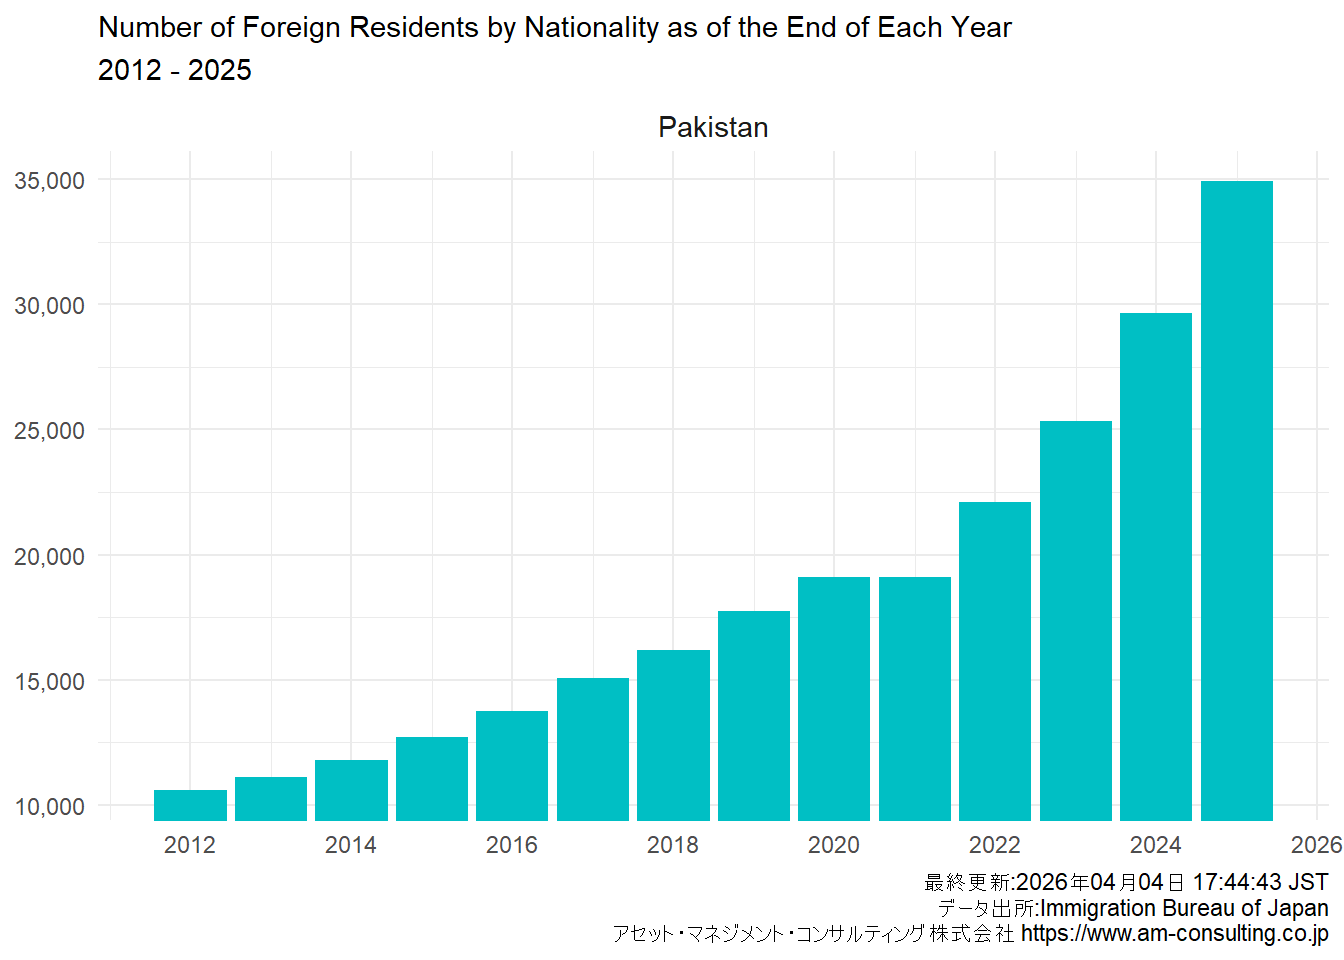
| 18 | Pakistan | 34,911 | 29,647 | 25,334 | 22,118 | 19,120 | 19,103 | 17,766 | 16,198 | 15,069 | 13,752 | 12,708 | 11,802 | 11,124 | 10,599 |
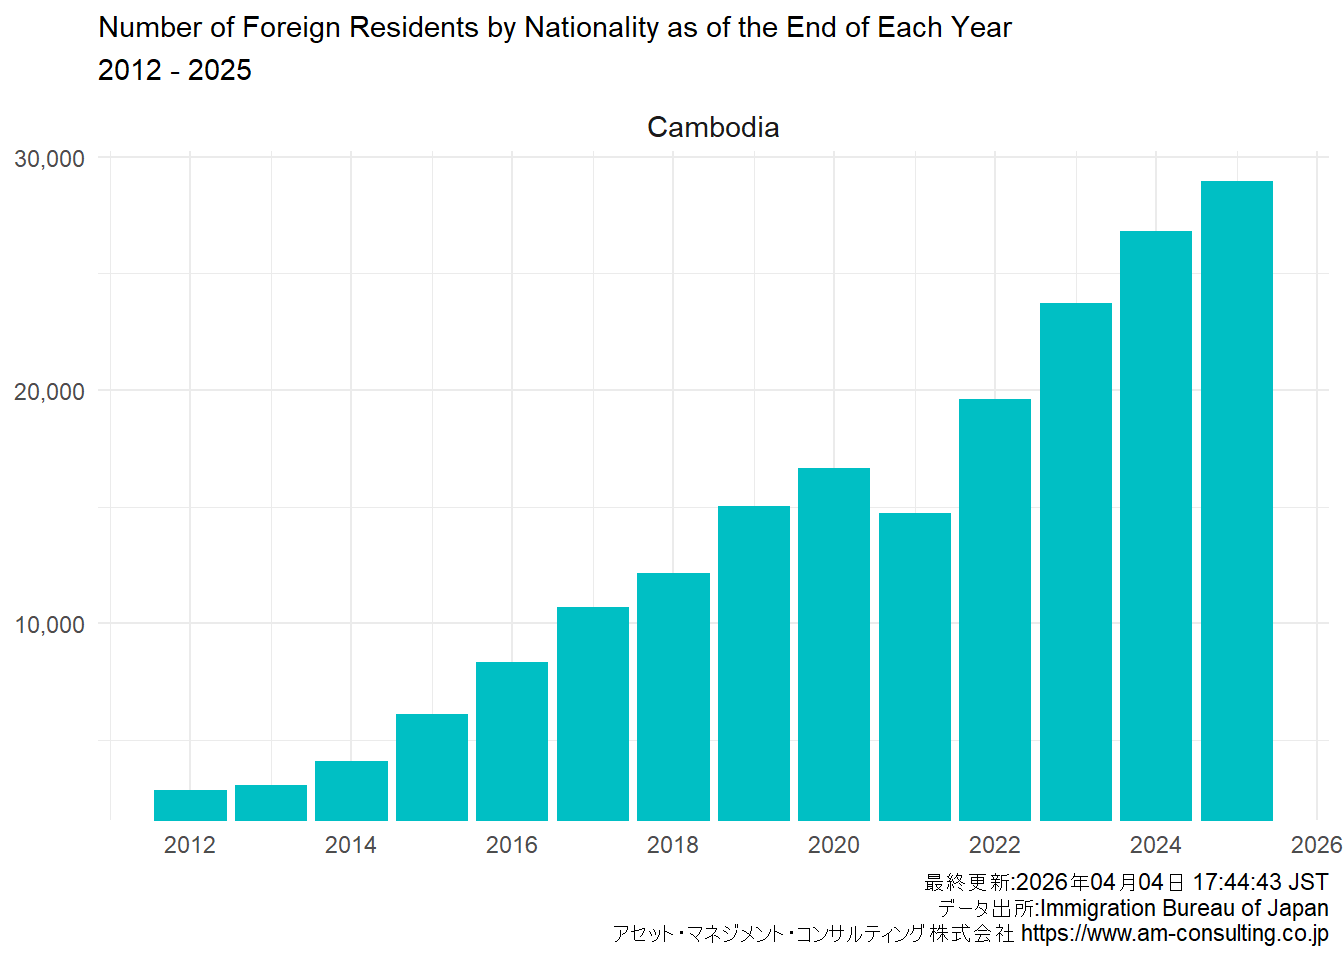
| 19 | Cambodia | 28,957 | 26,827 | 23,750 | 19,604 | 14,736 | 16,659 | 15,020 | 12,174 | 10,719 | 8,367 | 6,111 | 4,090 | 3,085 | 2,862 |
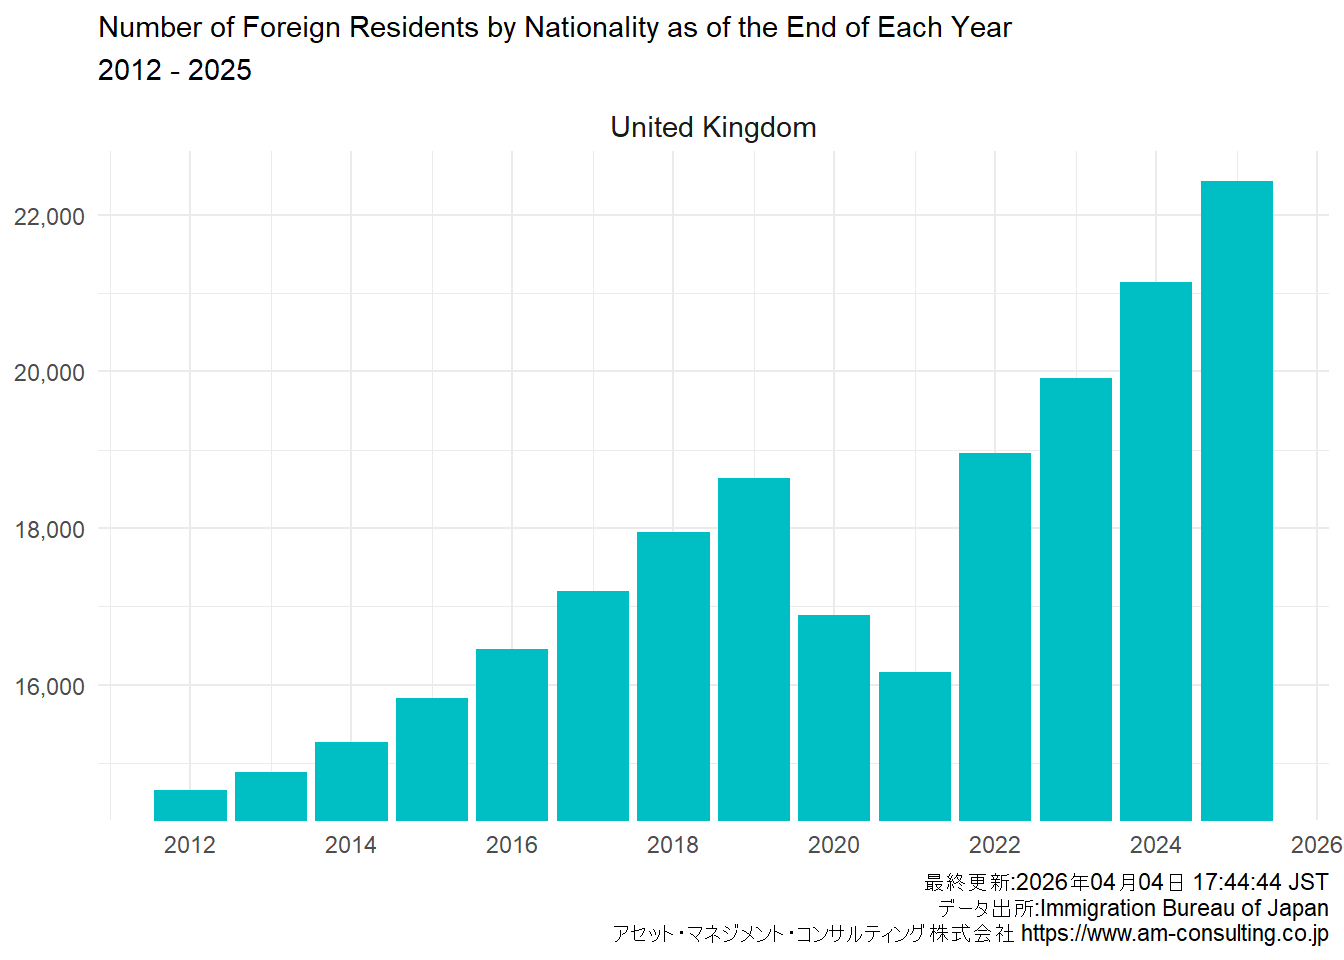
| 20 | United Kingdom | 22,428 | 21,139 | 19,909 | 18,959 | 16,163 | 16,891 | 18,631 | 17,943 | 17,200 | 16,454 | 15,826 | 15,262 | 14,881 | 14,653 |
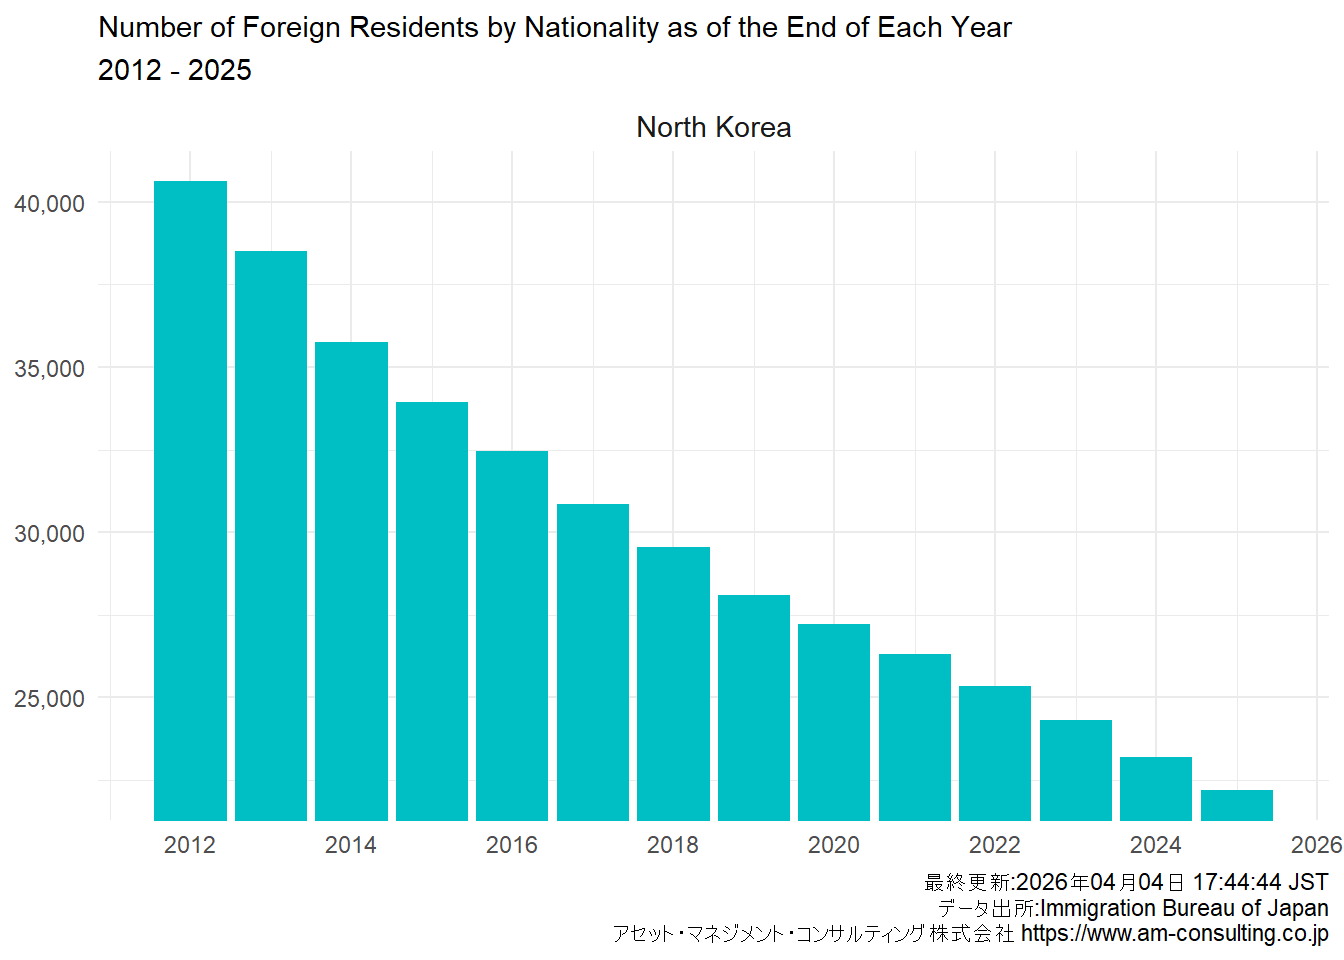
| 21 | North Korea | 22,201 | 23,206 | 24,305 | 25,358 | 26,312 | 27,214 | 28,096 | 29,559 | 30,859 | 32,461 | 33,939 | 35,753 | 38,491 | 40,617 |
| 22 | Mongolia | 21,359 | 21,240 | 19,490 | 16,580 | 12,425 | 13,504 | 12,797 | 10,987 | 9,144 | 7,636 | 6,590 | 5,796 | 5,180 | 4,837 |
1.1.1.2 Time series chart

1.1.2 Year-on-year
1.1.2.1 Time series table
| No | 系列 | 2025 | 2024 | 2023 | 2022 | 2021 | 2020 | 2019 | 2018 | 2017 | 2016 | 2015 | 2014 | 2013 |
|---|---|---|---|---|---|---|---|---|---|---|---|---|---|---|
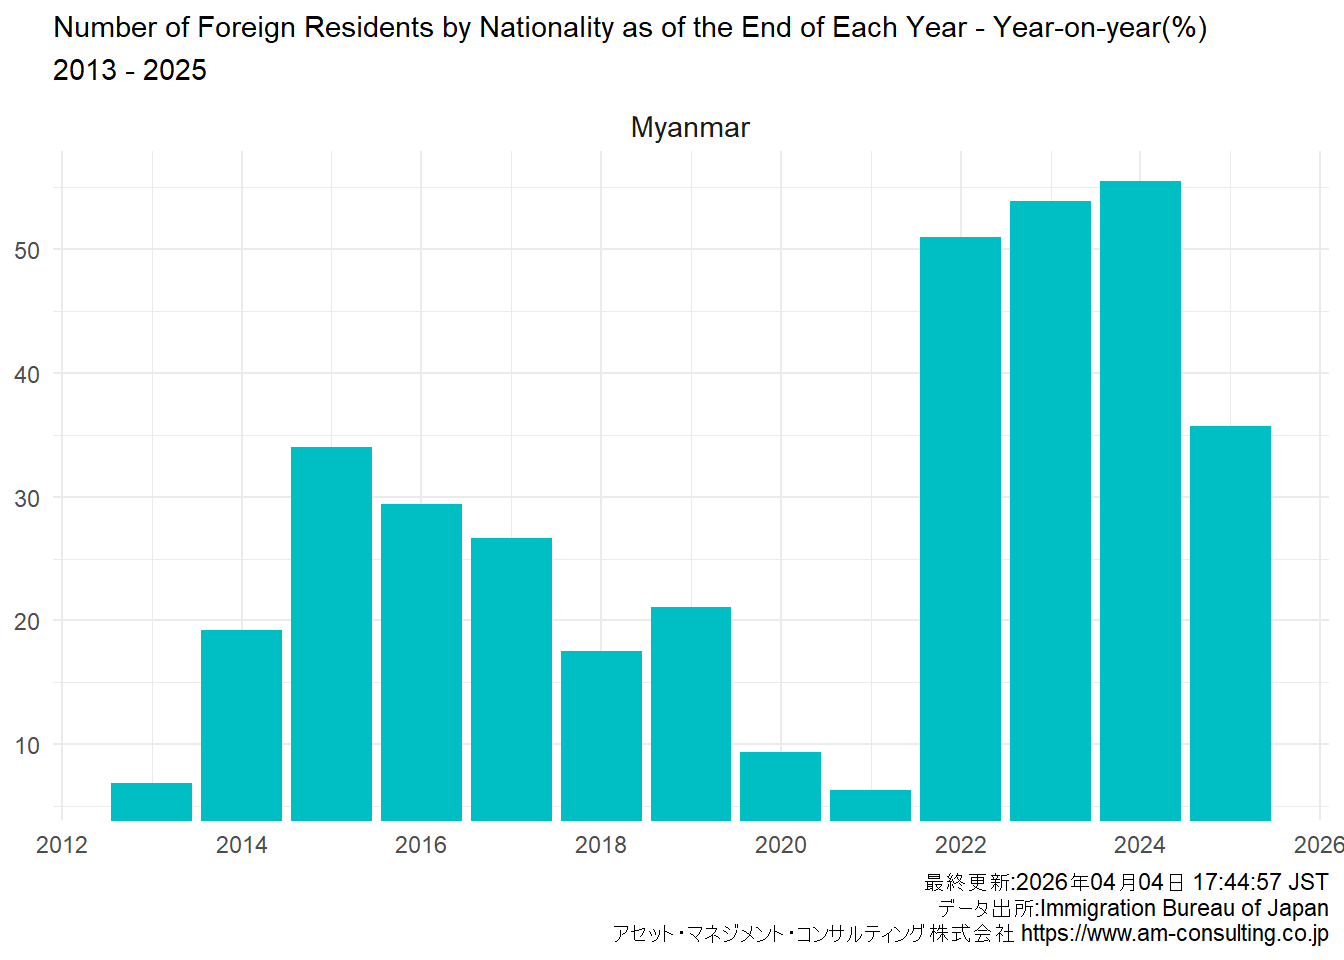
| 1 | Myanmar | 35.7 | 55.5 | 53.9 | 51 | 6.3 | 9.4 | 21.1 | 17.5 | 26.7 | 29.4 | 34 | 19.2 | 6.9 |
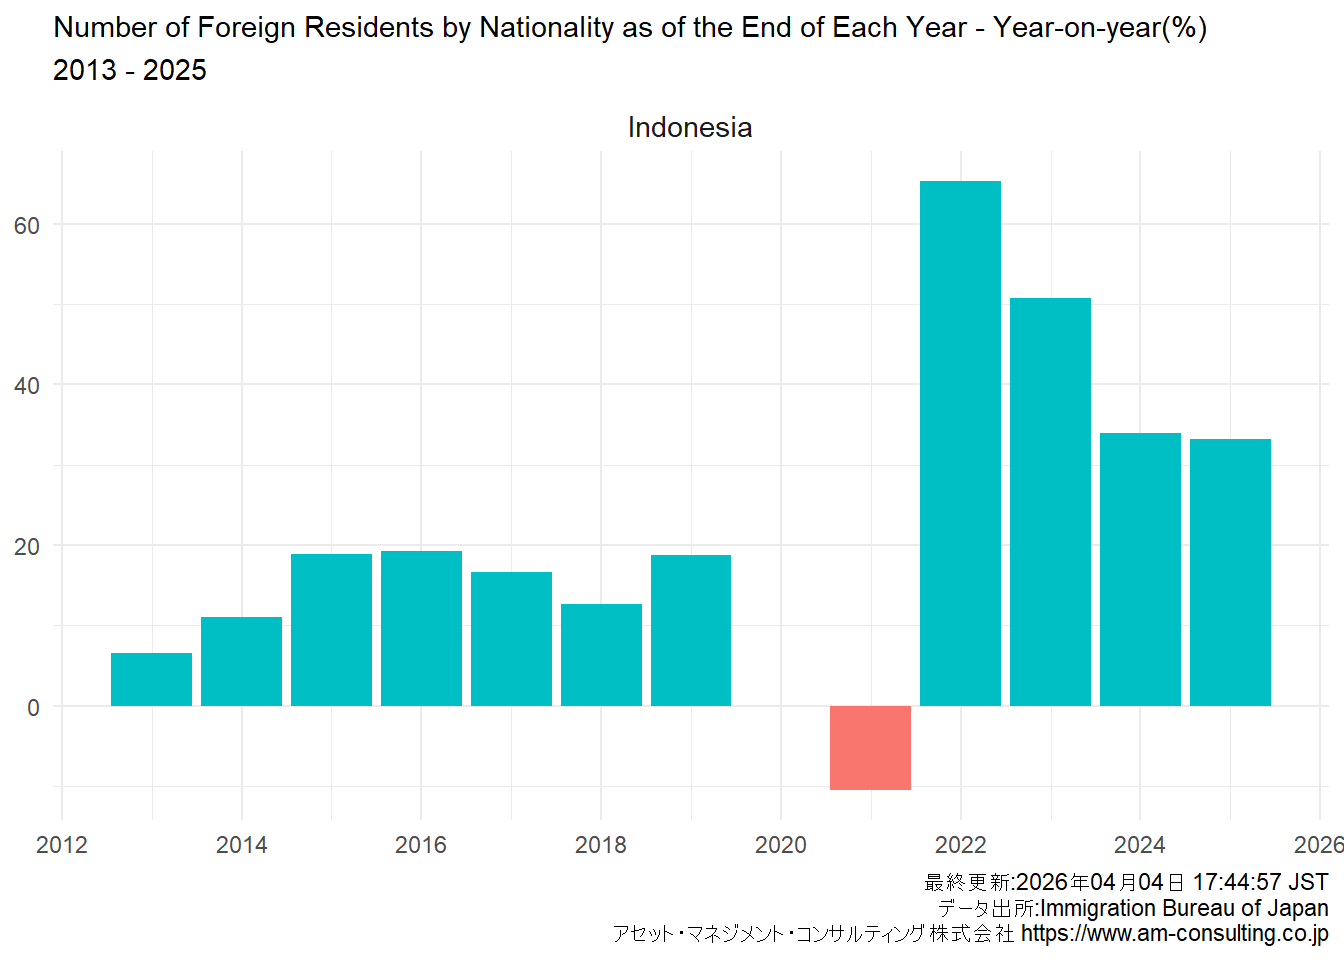
| 2 | Indonesia | 33.2 | 34 | 50.8 | 65.3 | -10.5 | 0 | 18.7 | 12.7 | 16.6 | 19.3 | 18.9 | 11 | 6.6 |
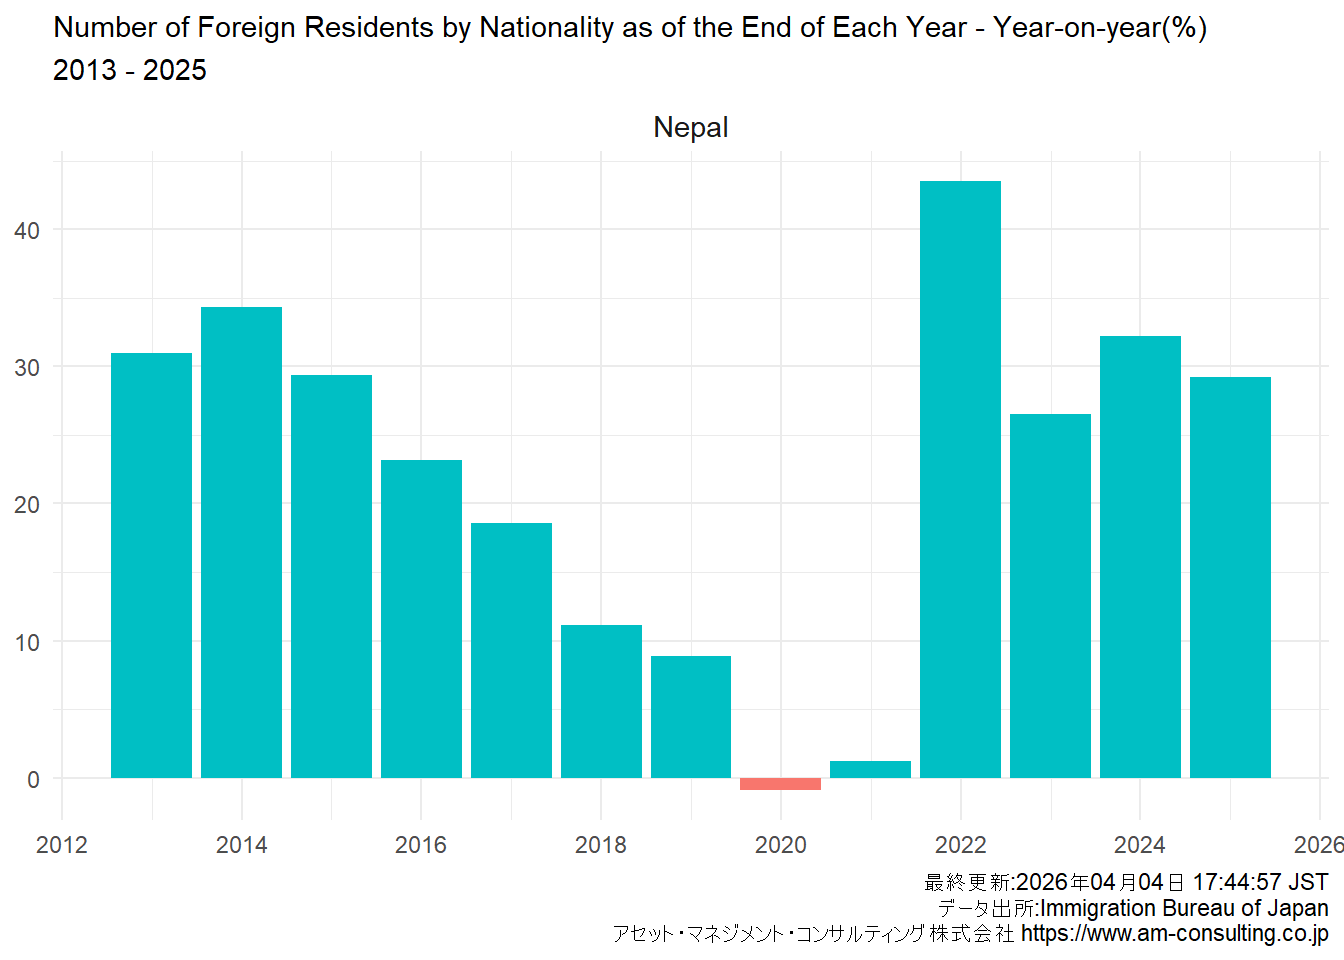
| 3 | Nepal | 29.2 | 32.2 | 26.5 | 43.5 | 1.2 | -0.9 | 8.9 | 11.1 | 18.6 | 23.2 | 29.4 | 34.3 | 31 |
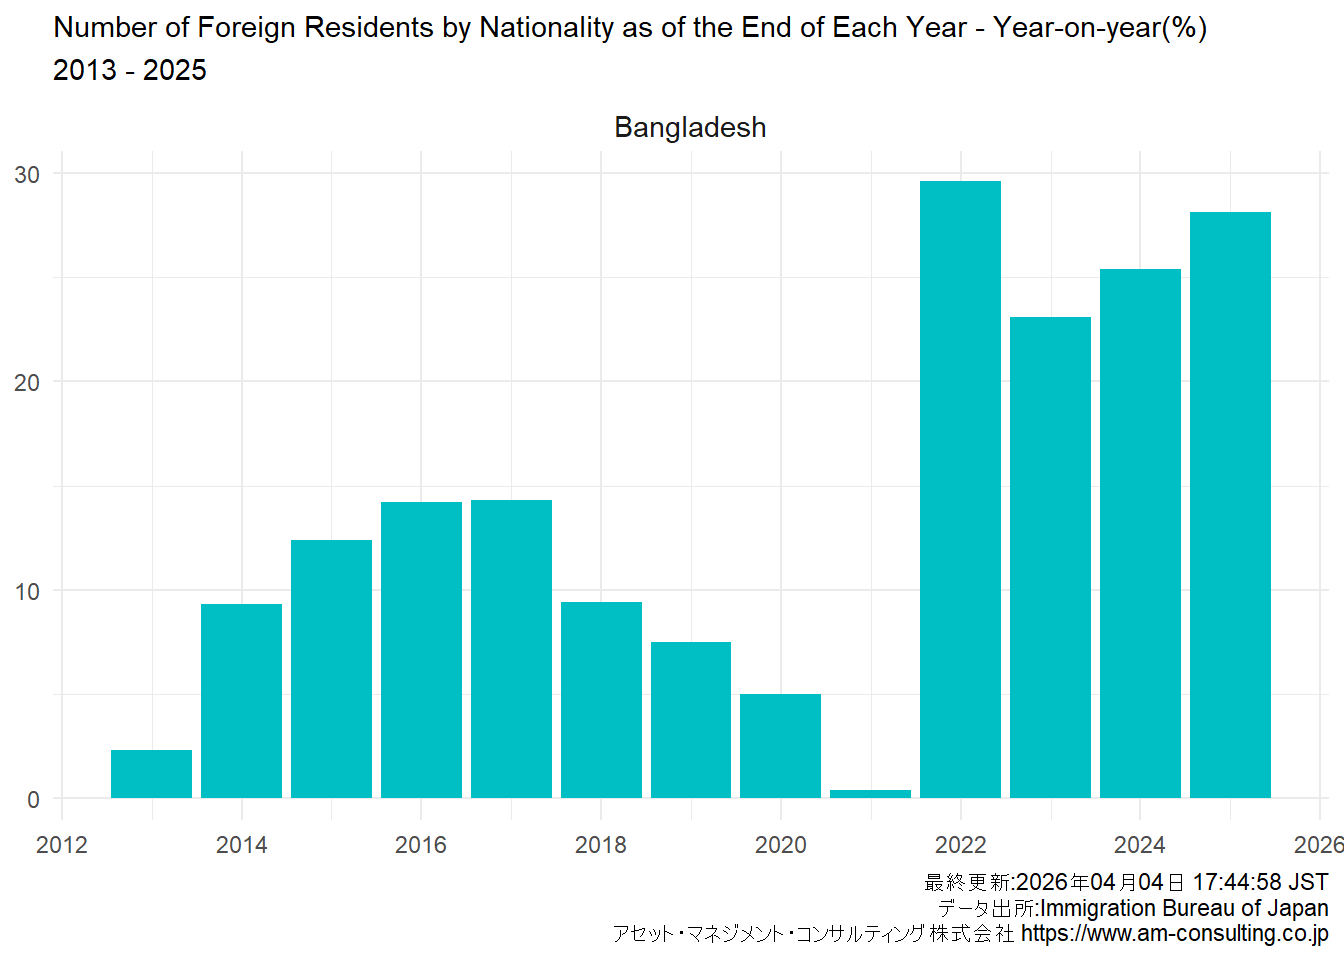
| 4 | Bangladesh | 28.1 | 25.4 | 23.1 | 29.6 | 0.4 | 5 | 7.5 | 9.4 | 14.3 | 14.2 | 12.4 | 9.3 | 2.3 |
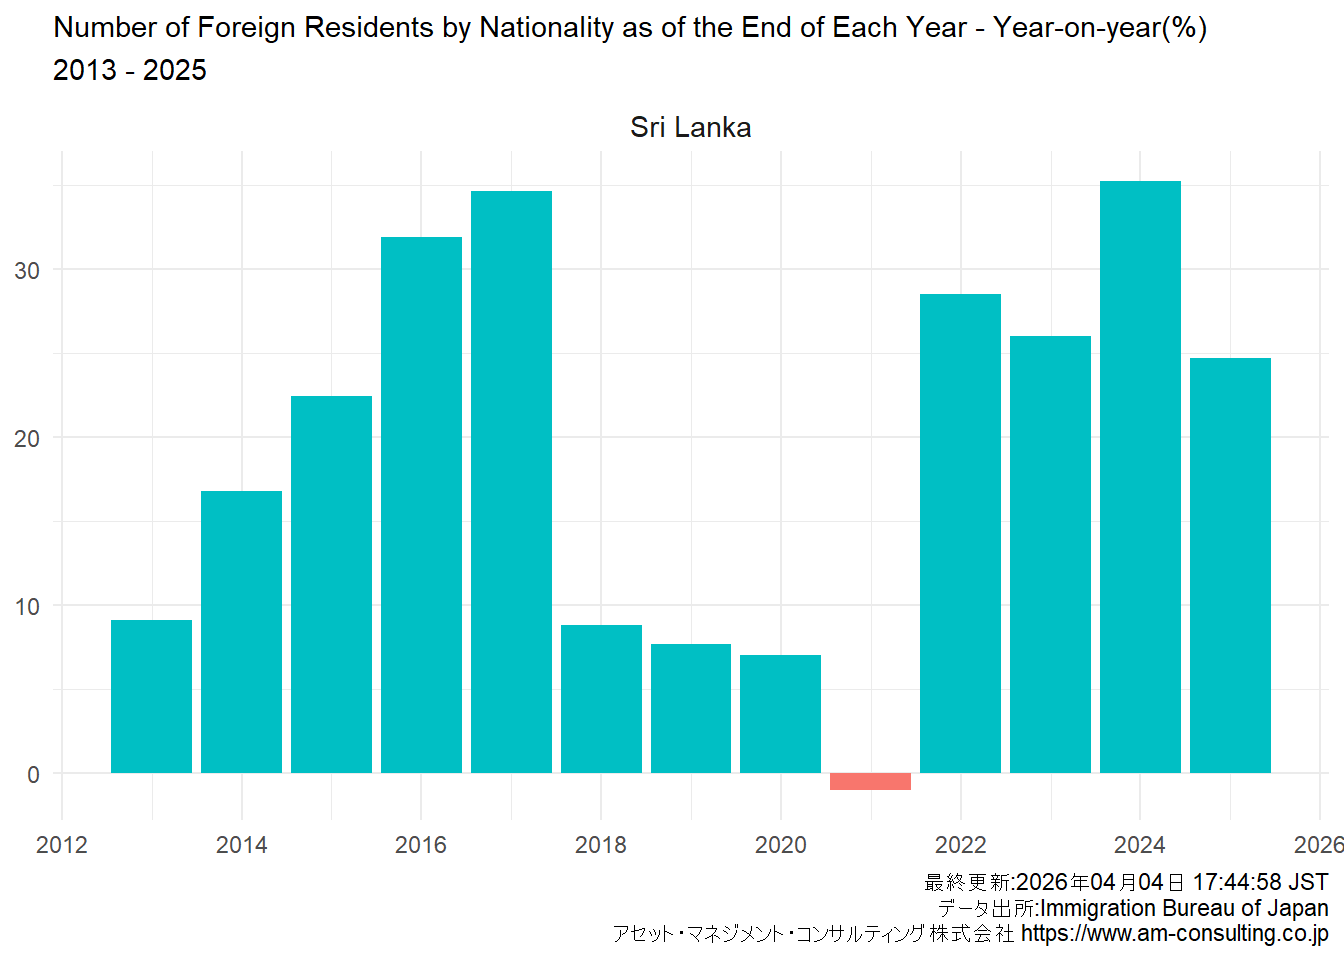
| 5 | Sri Lanka | 24.7 | 35.2 | 26 | 28.5 | -1 | 7 | 7.7 | 8.8 | 34.6 | 31.9 | 22.4 | 16.8 | 9.1 |
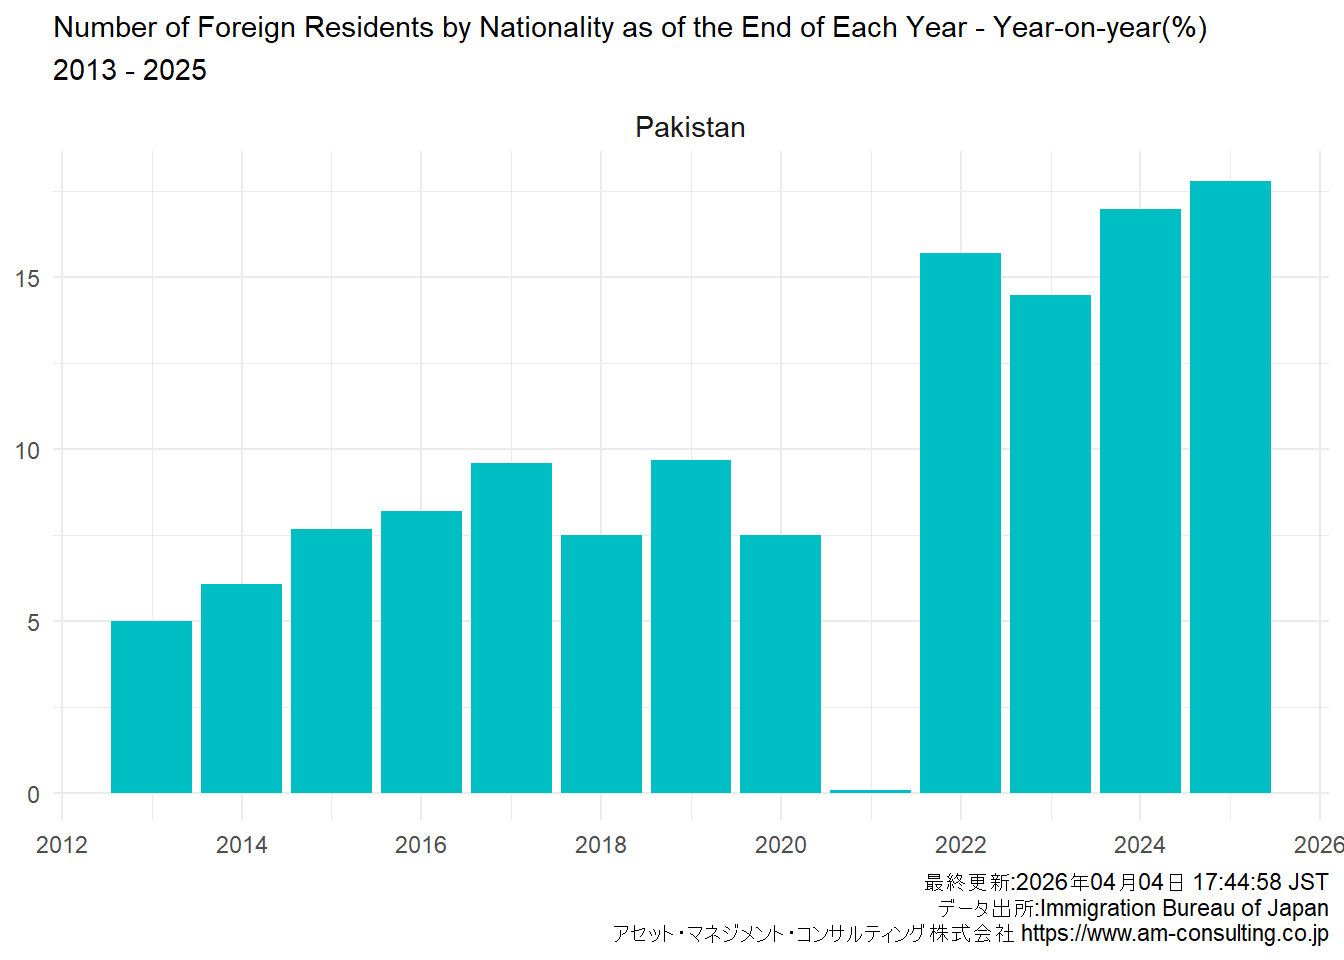
| 6 | Pakistan | 17.8 | 17 | 14.5 | 15.7 | 0.1 | 7.5 | 9.7 | 7.5 | 9.6 | 8.2 | 7.7 | 6.1 | 5 |
| 7 | Total | 9.5 | 10.5 | 10.9 | 11.4 | -4.4 | -1.6 | 7.4 | 6.6 | 7.5 | 6.7 | 5.2 | 2.7 | 1.6 |
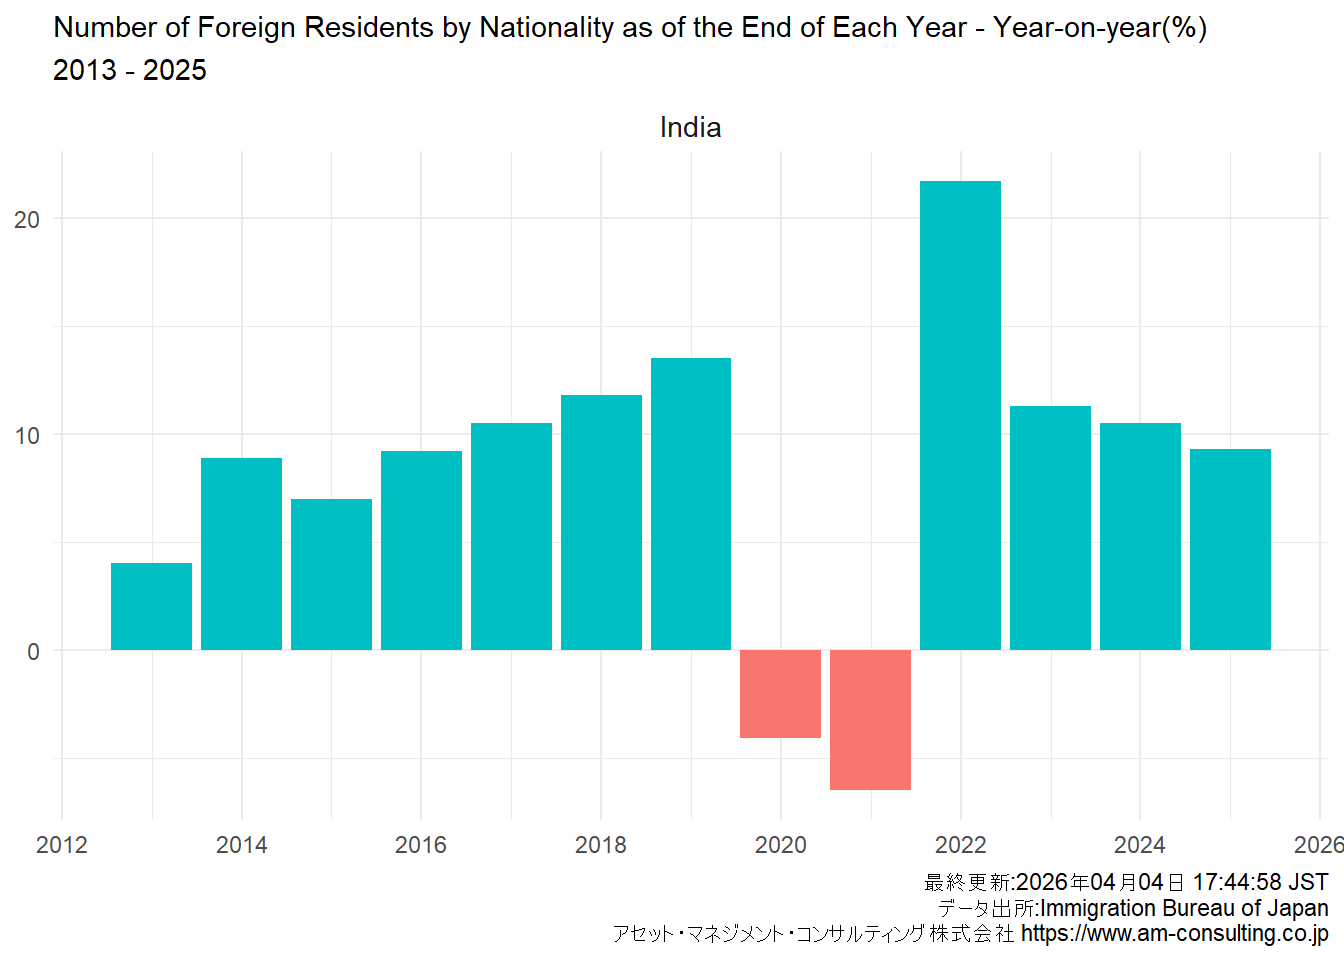
| 8 | India | 9.3 | 10.5 | 11.3 | 21.7 | -6.5 | -4.1 | 13.5 | 11.8 | 10.5 | 9.2 | 7 | 8.9 | 4 |
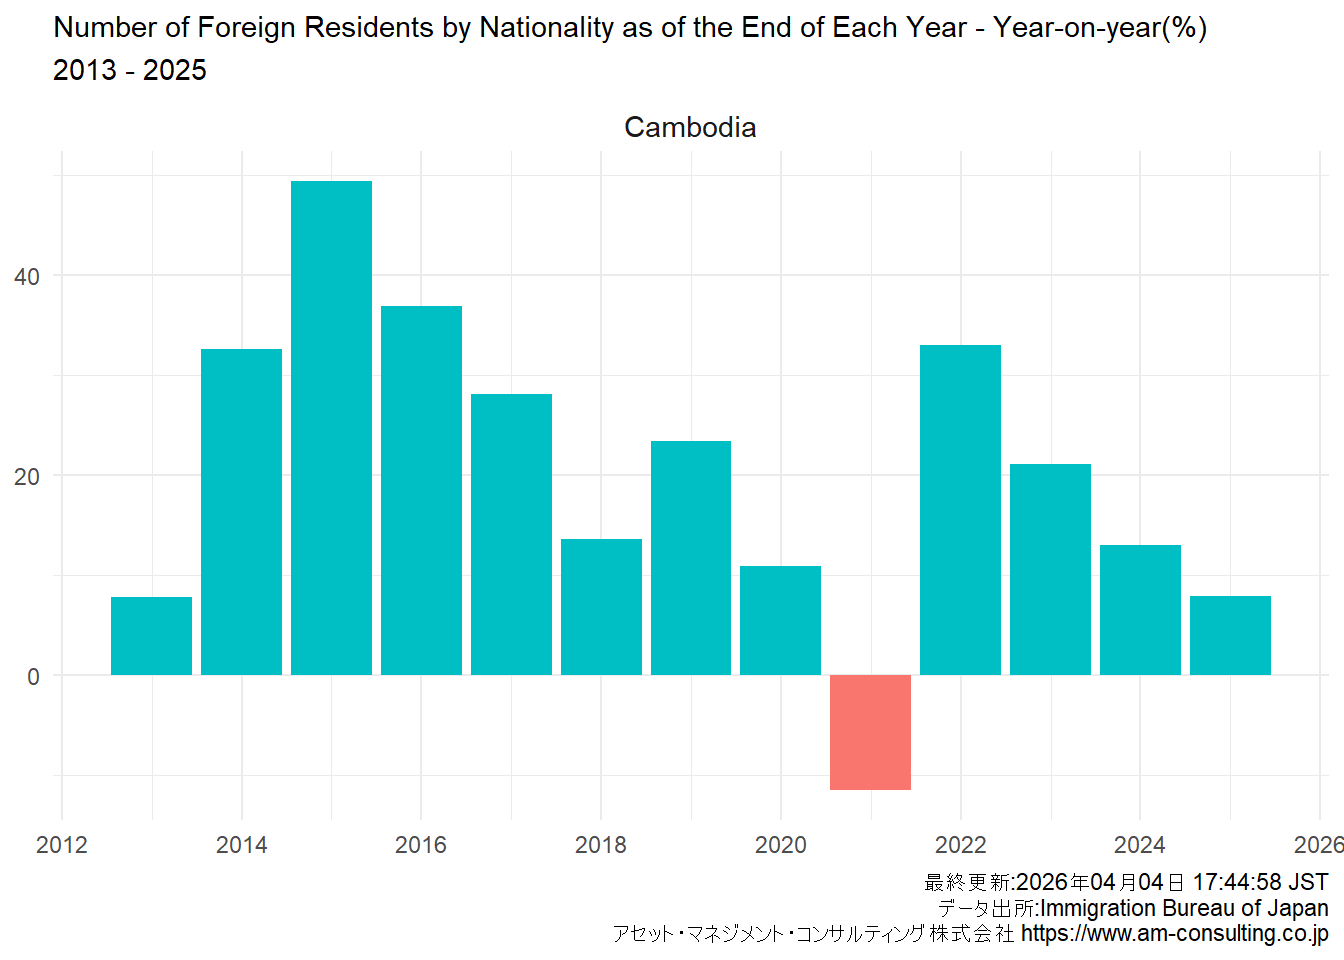
| 9 | Cambodia | 7.9 | 13 | 21.1 | 33 | -11.5 | 10.9 | 23.4 | 13.6 | 28.1 | 36.9 | 49.4 | 32.6 | 7.8 |
| 10 | Vietnam | 7.4 | 12.3 | 15.5 | 13 | -3.4 | 8.8 | 24.5 | 26.1 | 31.2 | 36.1 | 47.2 | 38.2 | 38 |
| 11 | China | 6.5 | 6.3 | 7.9 | 6.3 | -7.9 | -4.4 | 6.4 | 4.6 | 5.1 | 4.5 | 1.7 | 0.9 | -0.5 |
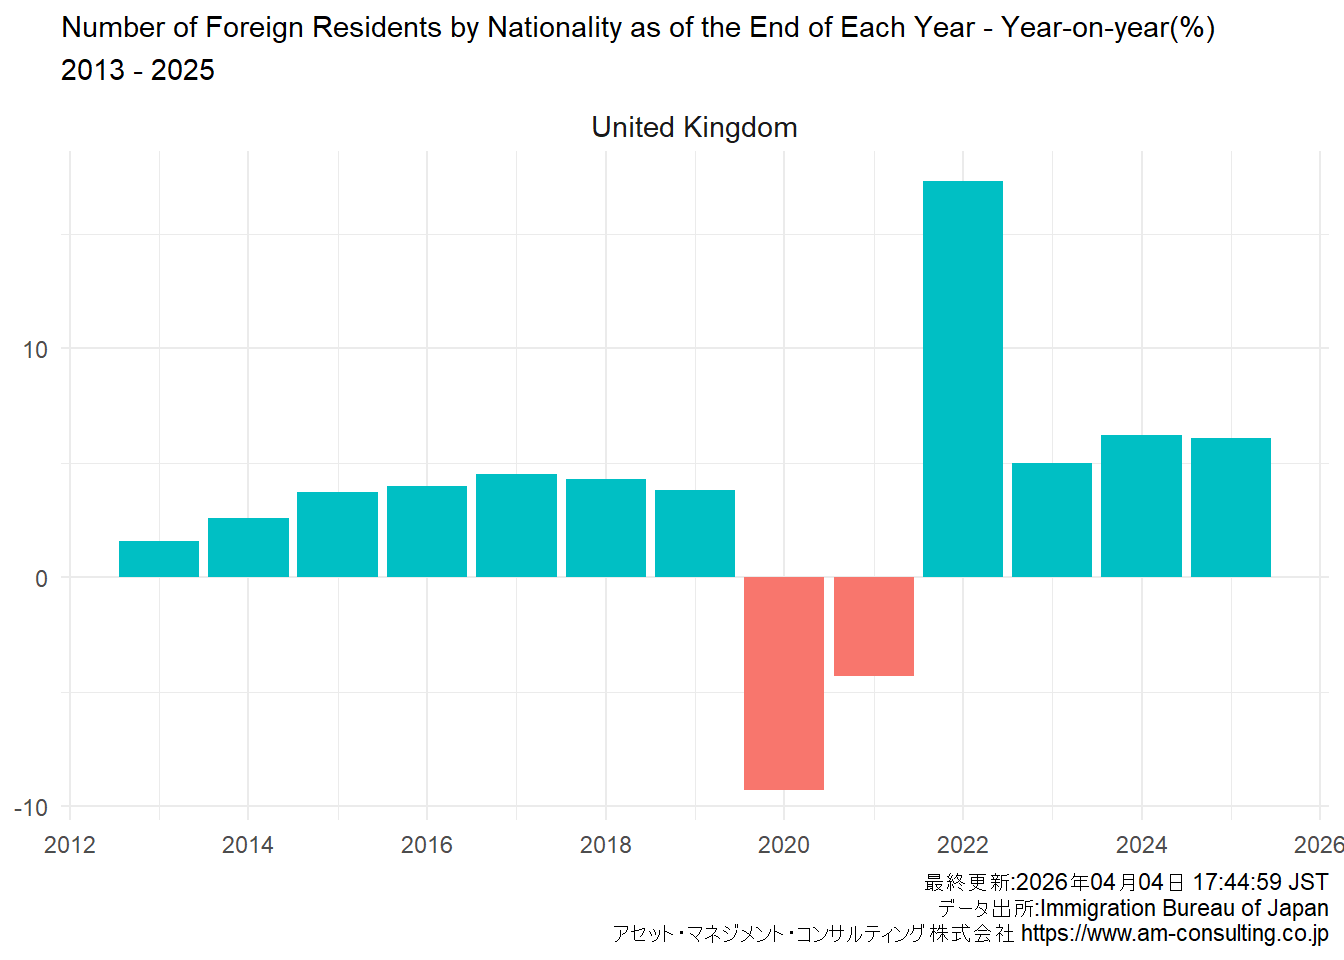
| 12 | United Kingdom | 6.1 | 6.2 | 5 | 17.3 | -4.3 | -9.3 | 3.8 | 4.3 | 4.5 | 4 | 3.7 | 2.6 | 1.6 |
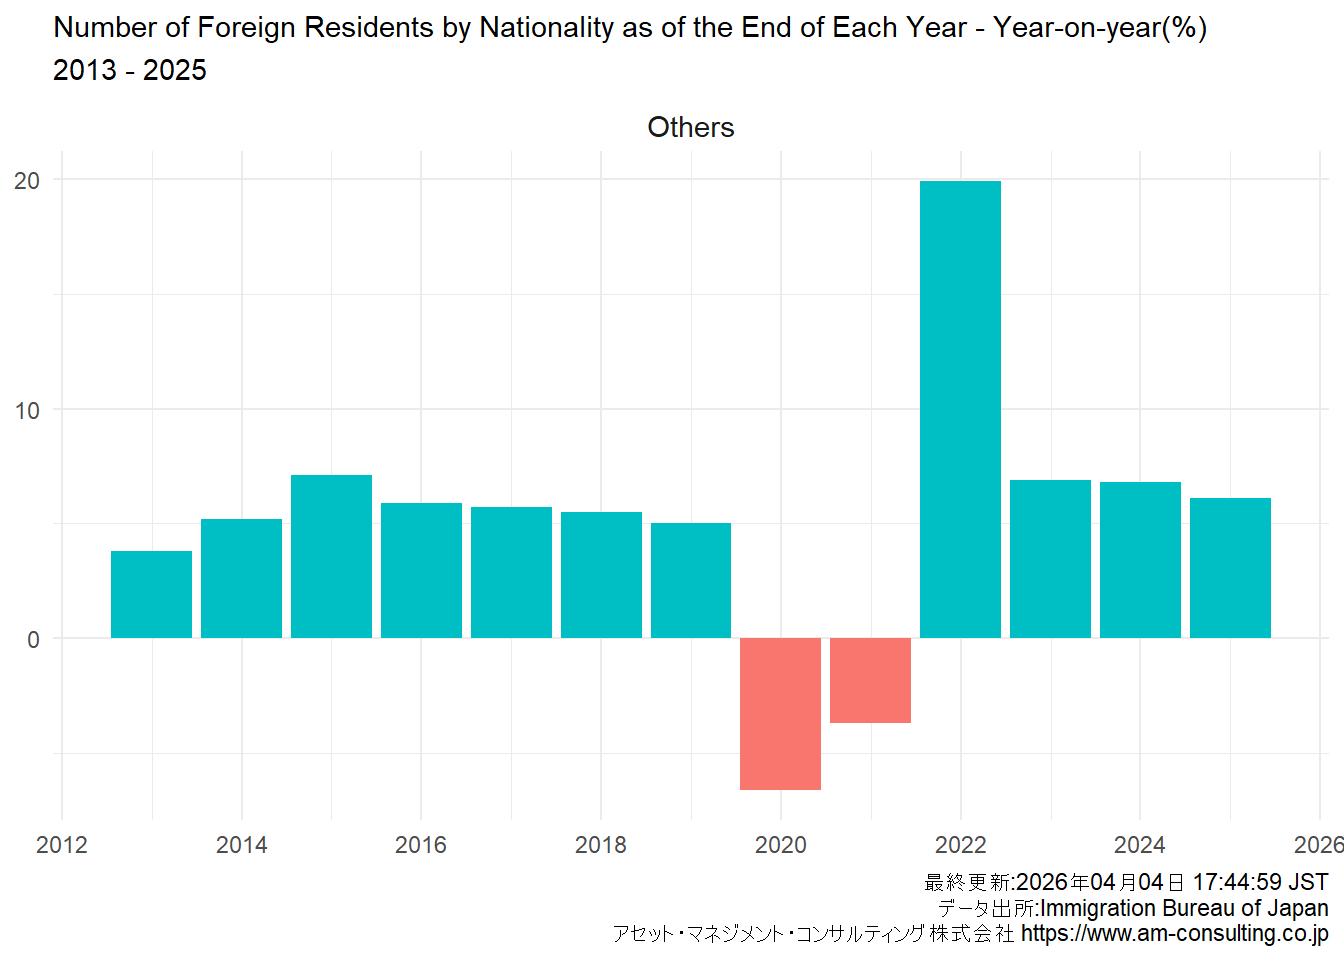
| 13 | Others | 6.1 | 6.8 | 6.9 | 19.9 | -3.7 | -6.6 | 5 | 5.5 | 5.7 | 5.9 | 7.1 | 5.2 | 3.8 |
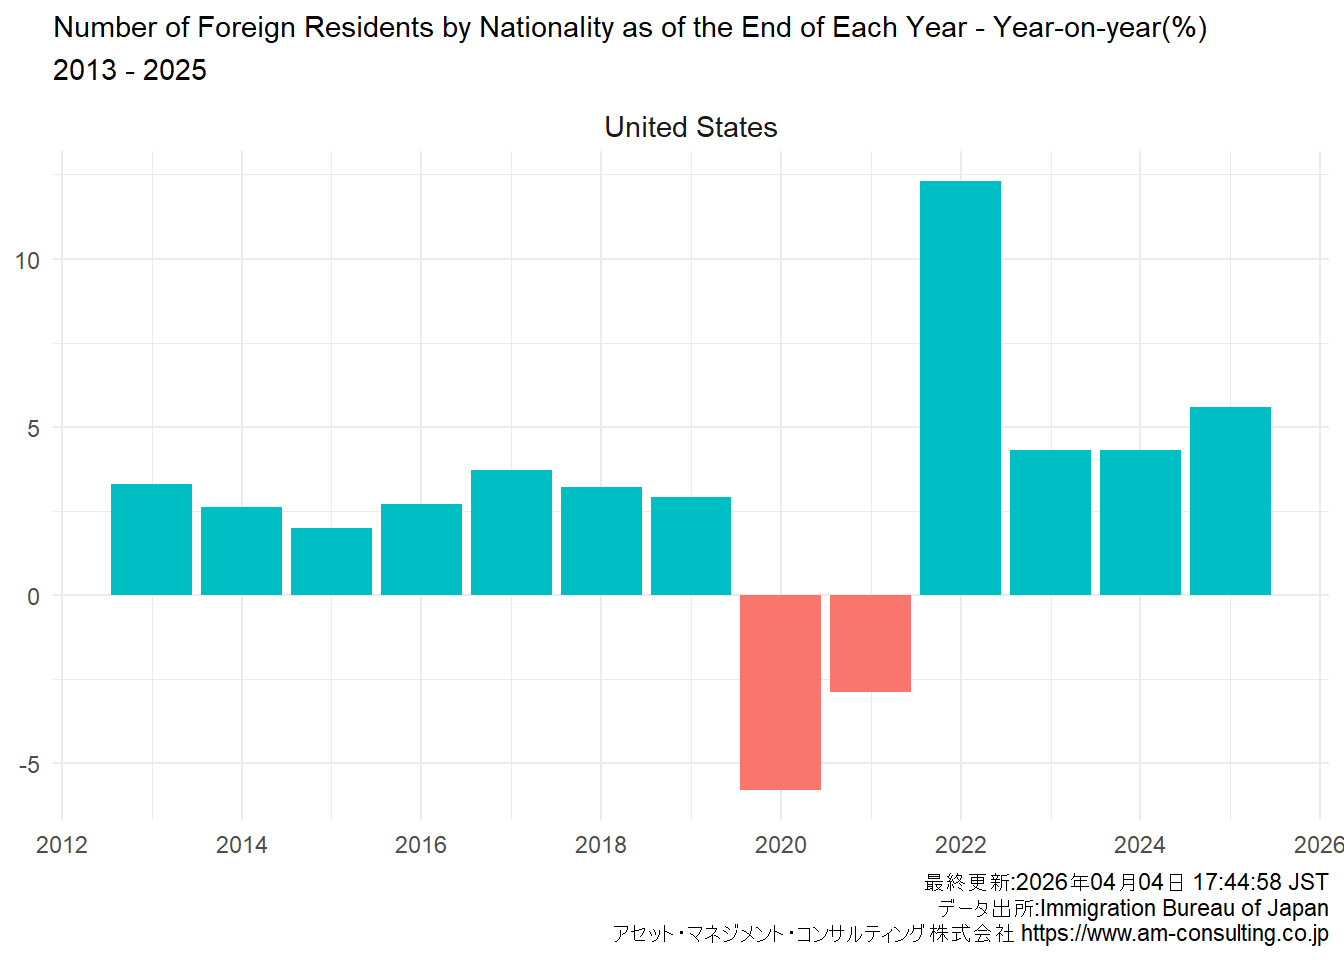
| 14 | United States | 5.6 | 4.3 | 4.3 | 12.3 | -2.9 | -5.8 | 2.9 | 3.2 | 3.7 | 2.7 | 2 | 2.6 | 3.3 |
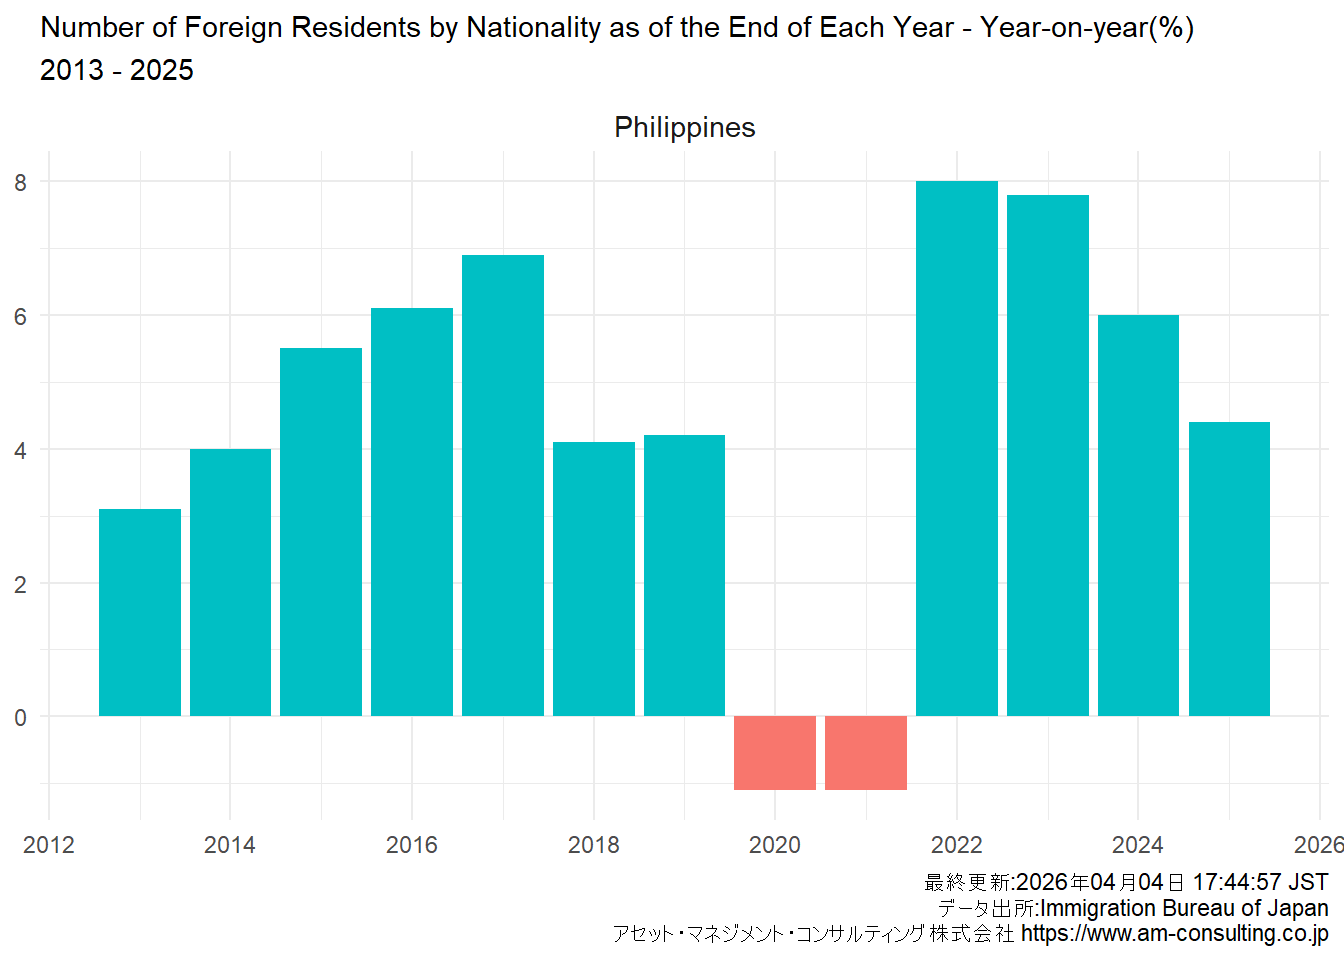
| 15 | Philippines | 4.4 | 6 | 7.8 | 8 | -1.1 | -1.1 | 4.2 | 4.1 | 6.9 | 6.1 | 5.5 | 4 | 3.1 |
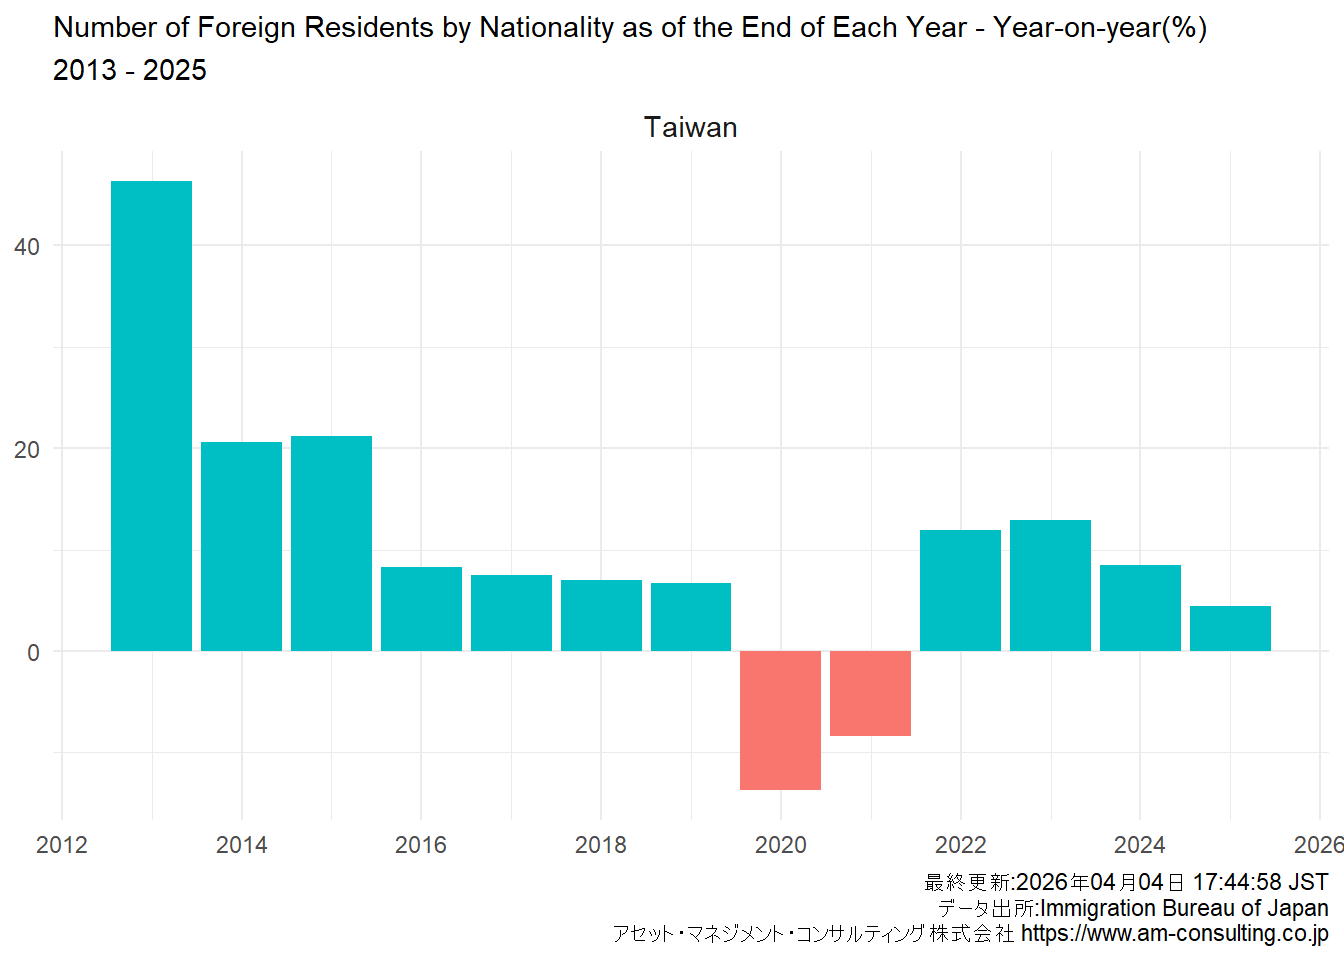
| 16 | Taiwan | 4.4 | 8.5 | 12.9 | 11.9 | -8.4 | -13.7 | 6.7 | 7 | 7.5 | 8.3 | 21.2 | 20.6 | 46.3 |
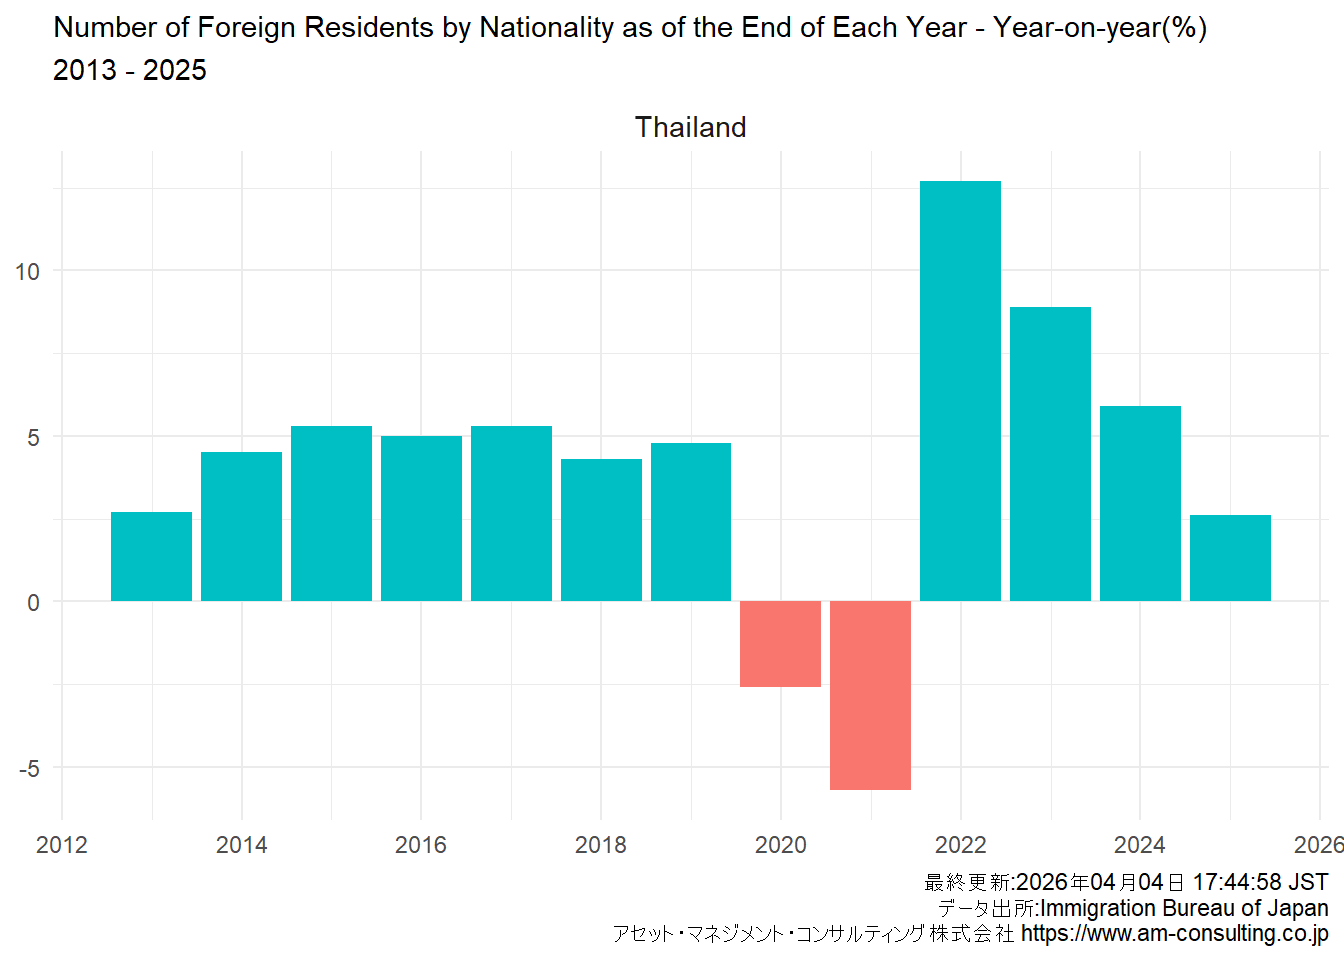
| 17 | Thailand | 2.6 | 5.9 | 8.9 | 12.7 | -5.7 | -2.6 | 4.8 | 4.3 | 5.3 | 5 | 5.3 | 4.5 | 2.7 |
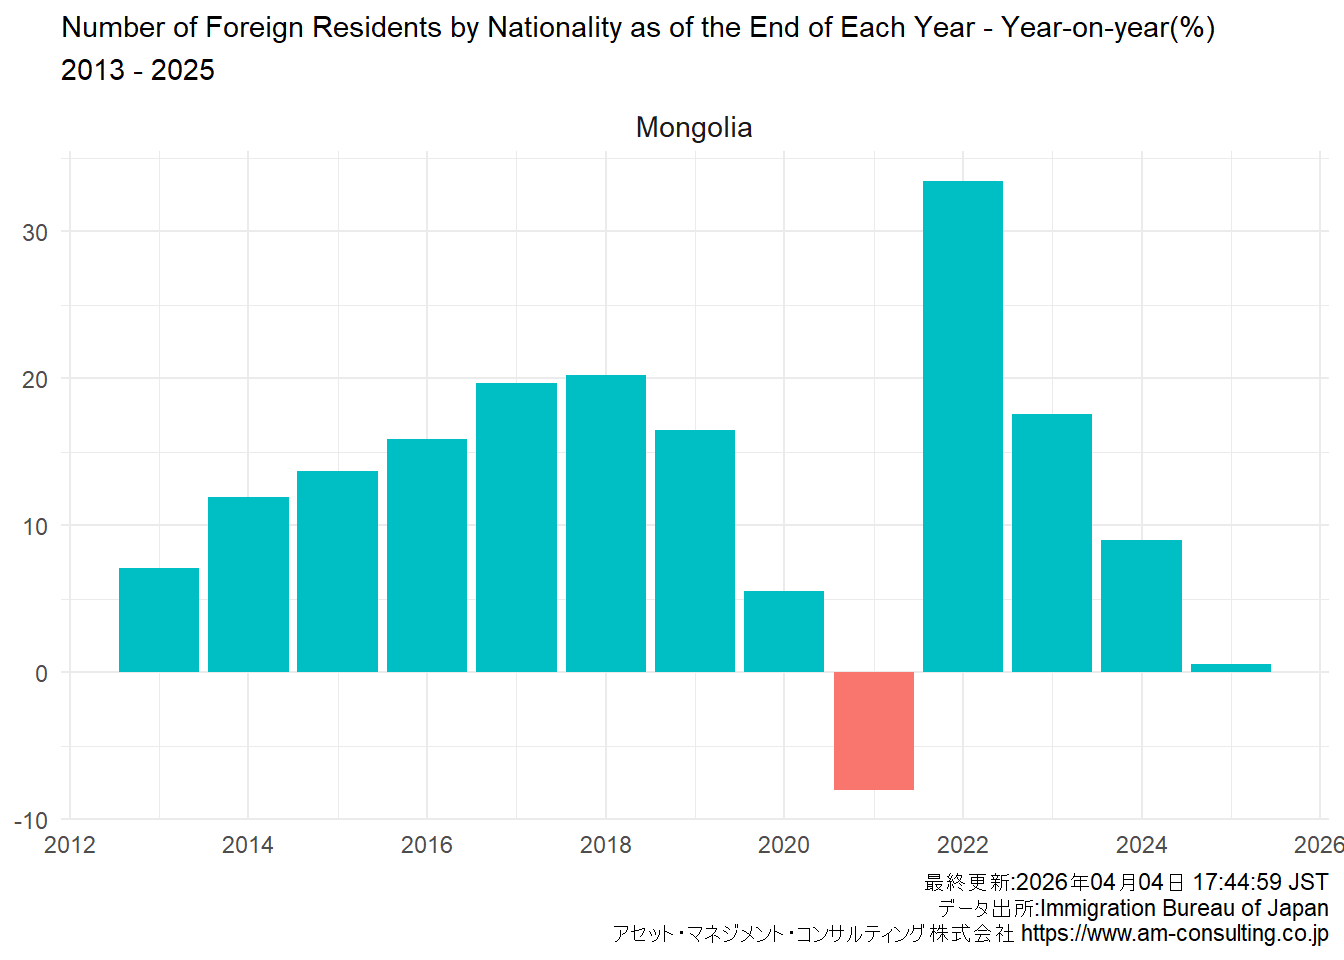
| 18 | Mongolia | 0.6 | 9 | 17.6 | 33.4 | -8 | 5.5 | 16.5 | 20.2 | 19.7 | 15.9 | 13.7 | 11.9 | 7.1 |
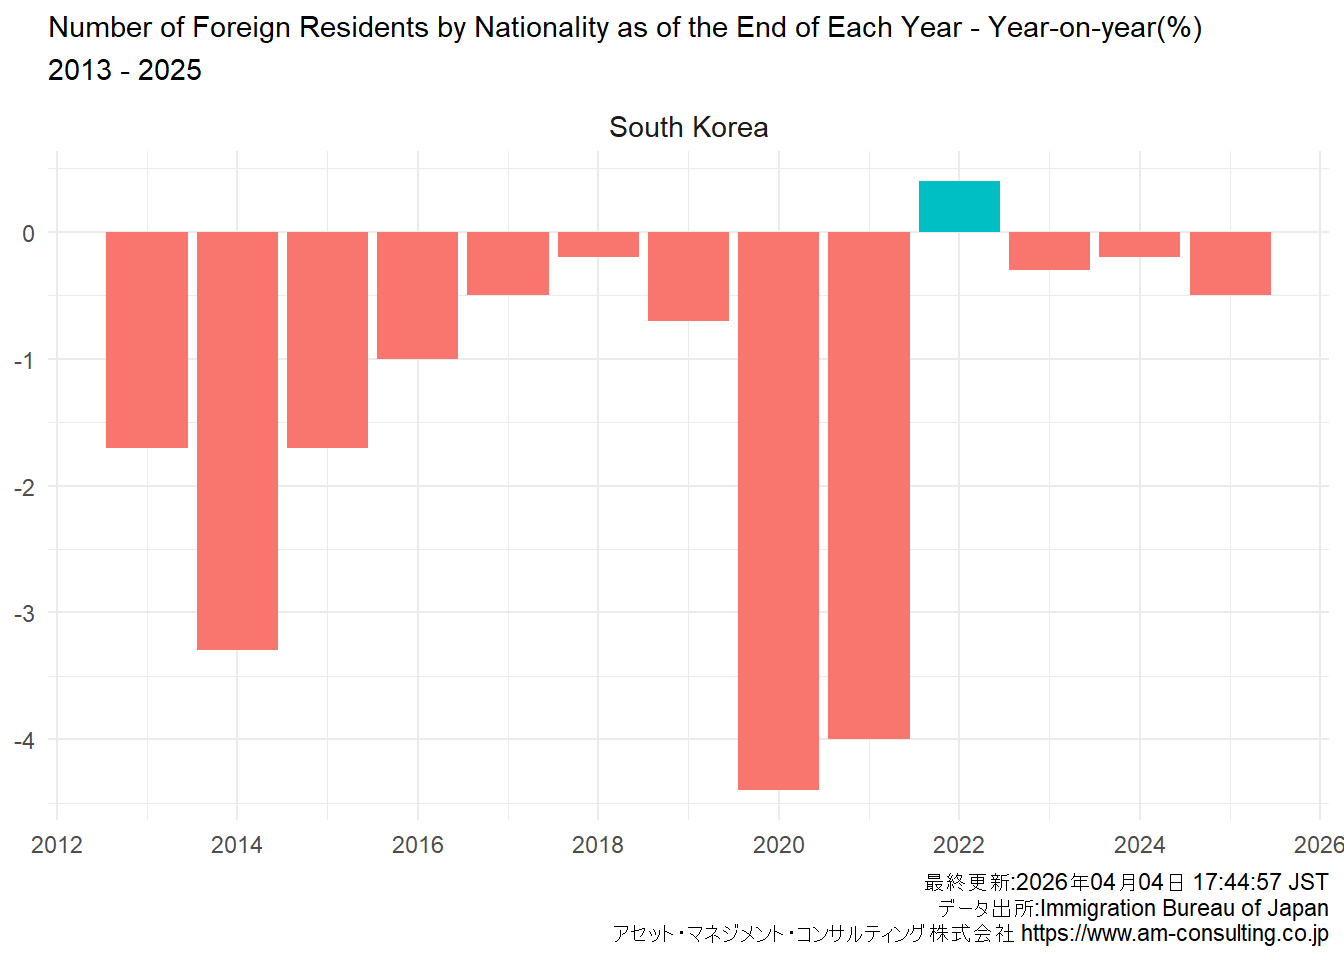
| 19 | South Korea | -0.5 | -0.2 | -0.3 | 0.4 | -4 | -4.4 | -0.7 | -0.2 | -0.5 | -1 | -1.7 | -3.3 | -1.7 |
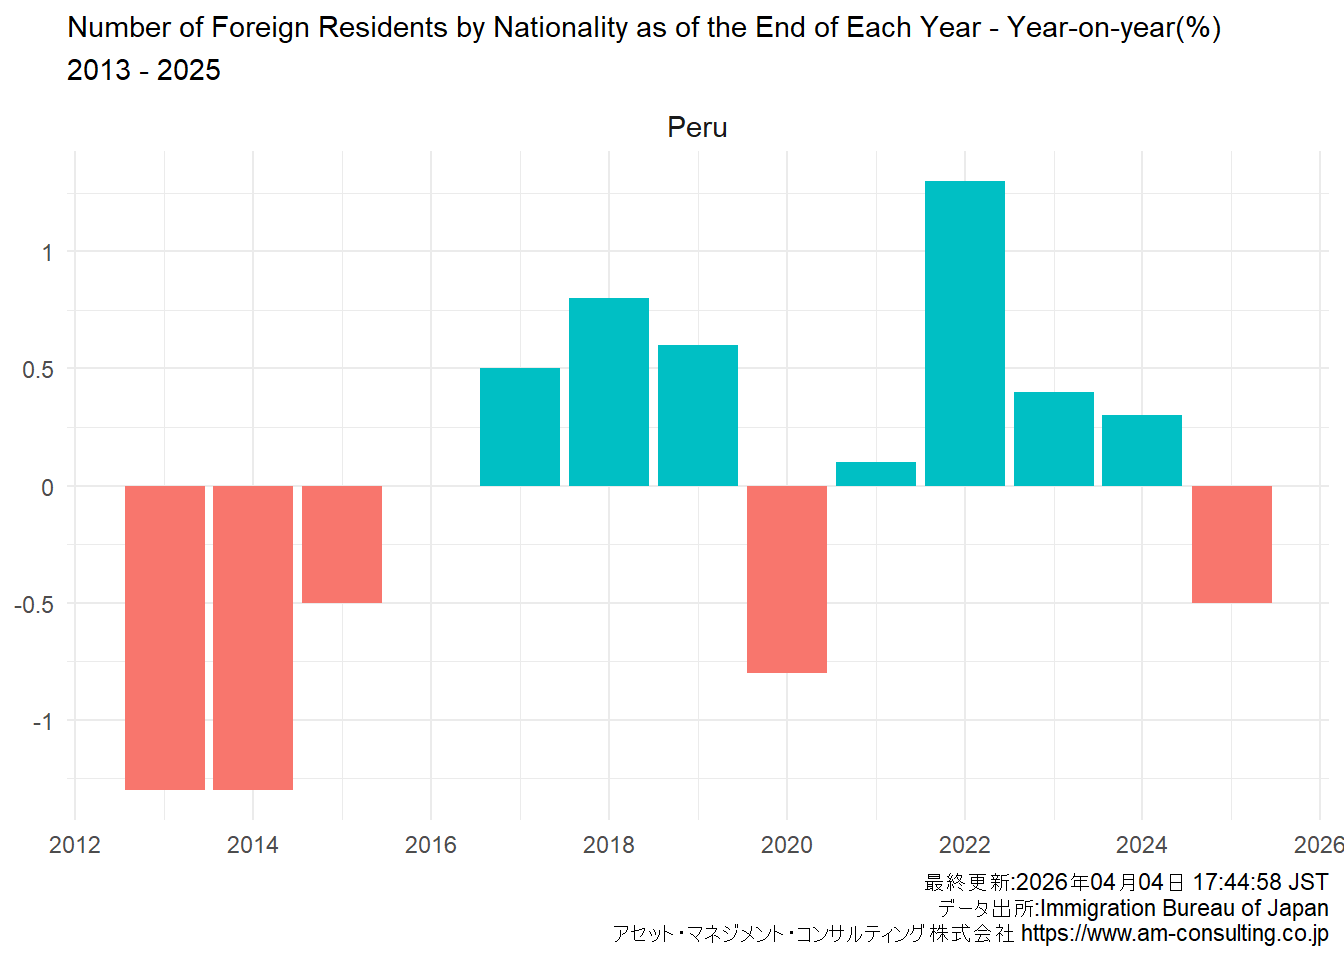
| 20 | Peru | -0.5 | 0.3 | 0.4 | 1.3 | 0.1 | -0.8 | 0.6 | 0.8 | 0.5 | 0 | -0.5 | -1.3 | -1.3 |
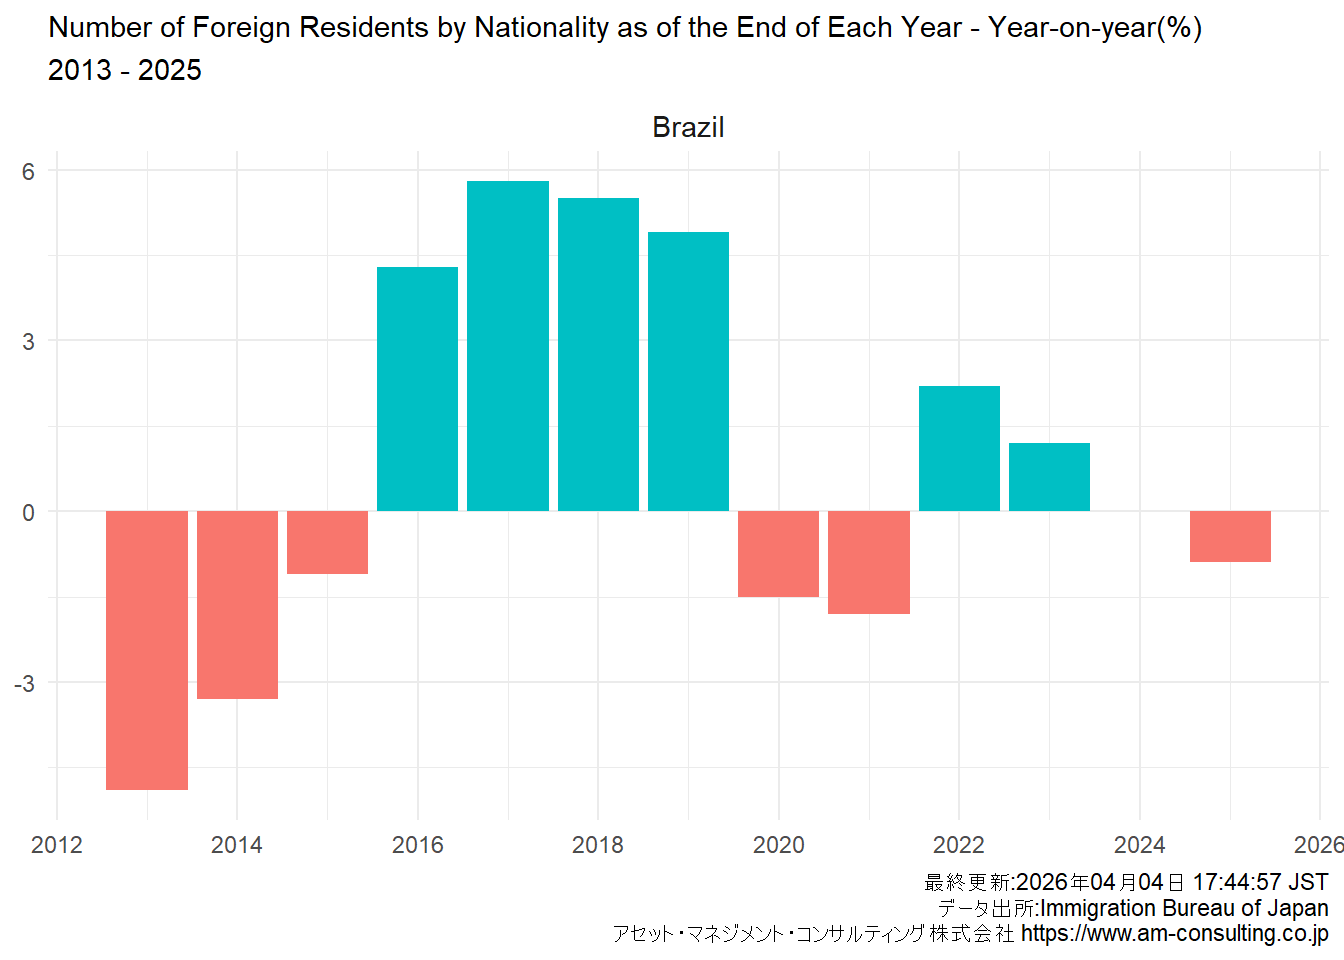
| 21 | Brazil | -0.9 | 0 | 1.2 | 2.2 | -1.8 | -1.5 | 4.9 | 5.5 | 5.8 | 4.3 | -1.1 | -3.3 | -4.9 |
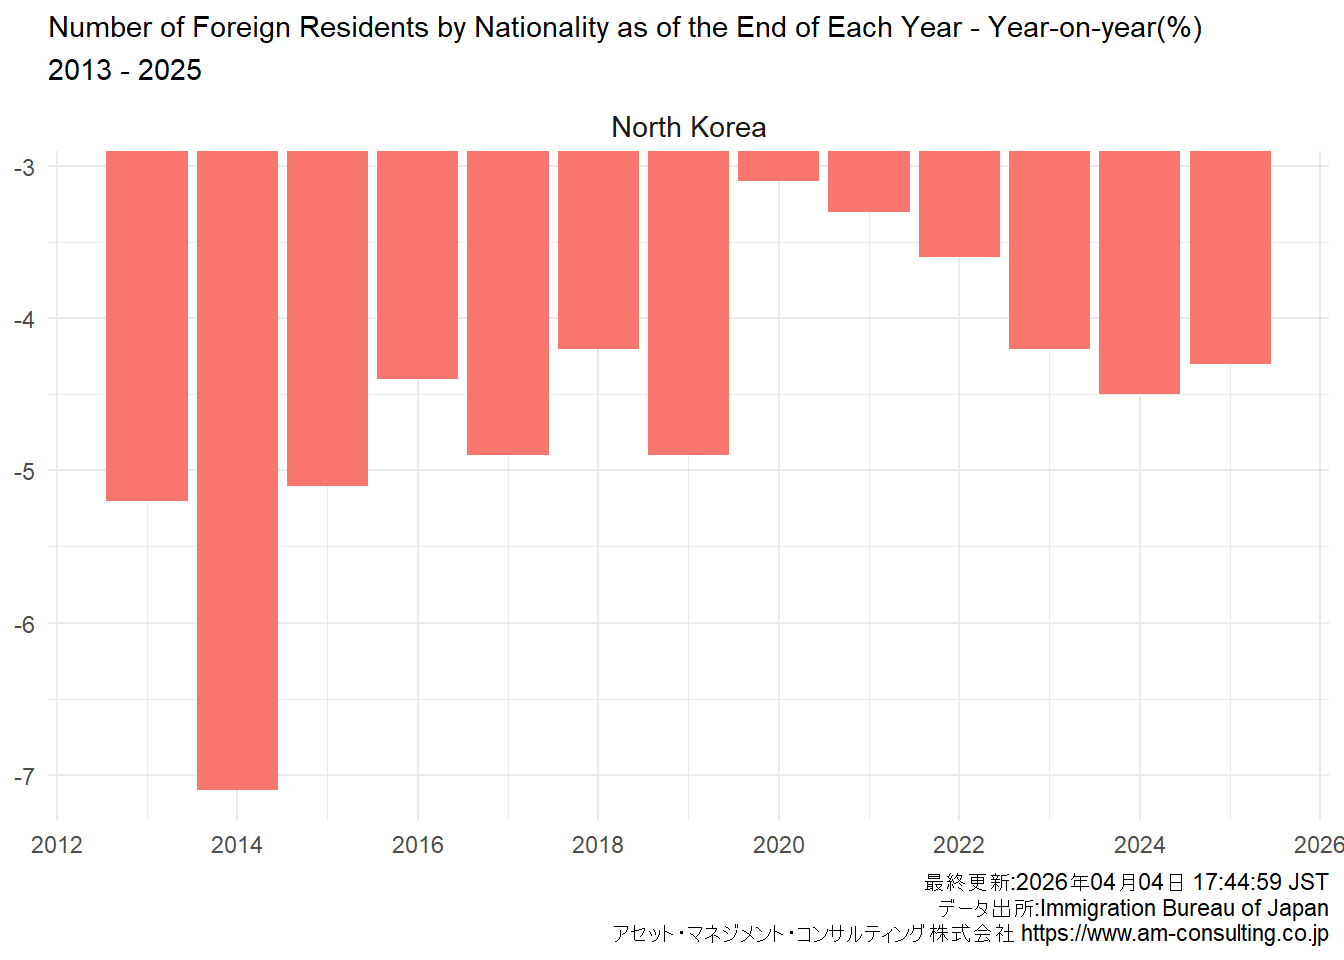
| 22 | North Korea | -4.3 | -4.5 | -4.2 | -3.6 | -3.3 | -3.1 | -4.9 | -4.2 | -4.9 | -4.4 | -5.1 | -7.1 | -5.2 |
1.1.2.2 Time series chart
2 Data Source
- Immigration Bureau of Japan
3 Release frequency
- Annually
4 Last updated date
Sys.time()[1] "2026-04-04 17:45:10 JST"6 R & Quarto
R.Version()$version.string[1] "R version 4.5.3 Patched (2026-03-11 r89773 ucrt)"quarto::quarto_version()[1] '1.9.36'