Which Prefecture Has The Highest Proportion Of Women In Japan?
1 The answer is…
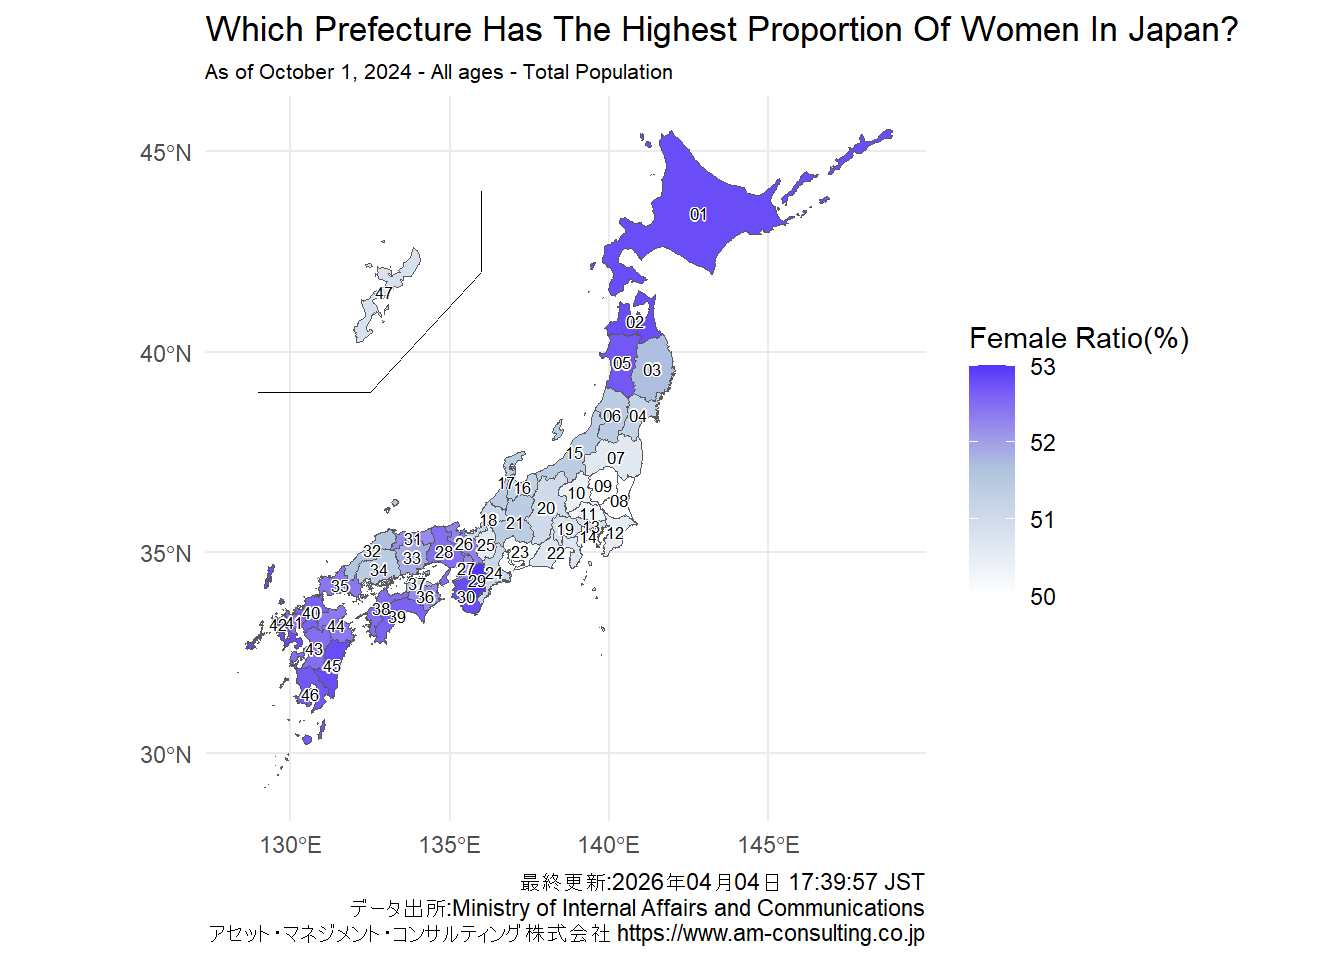
Time Point: As of October 1, 20245-year age groups: All agesNationality: Total PopulationUnit: Thousands
1.1 Population and Gender ratio by Prefecture - Table
| No | Area code | Japan and Prefectures | Male | Female | Male Ratio(%) | Female Ratio(%) |
|---|---|---|---|---|---|---|
| 1 | 29 | Nara | 604 | 681 | 47.0 | 53.0 |
| 2 | 01 | Hokkaido | 2,382 | 2,661 | 47.2 | 52.8 |
| 3 | 02 | Aomori | 549 | 615 | 47.2 | 52.8 |
| 4 | 30 | Wakayama | 415 | 465 | 47.2 | 52.8 |
| 5 | 42 | Nagasaki | 591 | 661 | 47.2 | 52.8 |
| 6 | 45 | Miyazaki | 488 | 545 | 47.2 | 52.8 |
| 7 | 05 | Akita | 424 | 473 | 47.3 | 52.7 |
| 8 | 46 | Kagoshima | 724 | 807 | 47.3 | 52.7 |
| 9 | 39 | Kochi | 311 | 345 | 47.4 | 52.6 |
| 10 | 40 | Fukuoka | 2,413 | 2,678 | 47.4 | 52.6 |
| 11 | 28 | Hyogo | 2,535 | 2,802 | 47.5 | 52.5 |
| 12 | 38 | Ehime | 606 | 669 | 47.5 | 52.5 |
| 13 | 41 | Saga | 375 | 414 | 47.5 | 52.5 |
| 14 | 43 | Kumamoto | 806 | 891 | 47.5 | 52.5 |
| 15 | 35 | Yamaguchi | 610 | 671 | 47.6 | 52.4 |
| 16 | 44 | Oita | 517 | 568 | 47.6 | 52.4 |
| 17 | 26 | Kyoto | 1,203 | 1,317 | 47.7 | 52.3 |
| 18 | 27 | Osaka | 4,185 | 4,572 | 47.8 | 52.2 |
| 19 | 31 | Tottori | 254 | 277 | 47.8 | 52.2 |
| 20 | 36 | Tokushima | 328 | 358 | 47.8 | 52.2 |
| 21 | 33 | Okayama | 882 | 950 | 48.1 | 51.9 |
| 22 | 03 | Iwate | 553 | 592 | 48.3 | 51.7 |
| 23 | 32 | Shimane | 311 | 331 | 48.4 | 51.6 |
| 24 | 37 | Kagawa | 444 | 473 | 48.4 | 51.6 |
| 25 | 06 | Yamagata | 491 | 520 | 48.6 | 51.4 |
| 26 | 15 | Niigata | 1,021 | 1,078 | 48.6 | 51.4 |
| 27 | 17 | Ishikawa | 534 | 564 | 48.6 | 51.4 |
| 28 | 21 | Gifu | 930 | 985 | 48.6 | 51.4 |
| 29 | 34 | Hiroshima | 1,318 | 1,396 | 48.6 | 51.4 |
| 30 | - | Nationwide | 60,233 | 63,569 | 48.7 | 51.3 |
| 31 | 16 | Toyama | 486 | 511 | 48.7 | 51.3 |
| 32 | 04 | Miyagi | 1,096 | 1,152 | 48.8 | 51.2 |
| 33 | 18 | Fukui | 361 | 377 | 48.9 | 51.1 |
| 34 | 24 | Mie | 837 | 874 | 48.9 | 51.1 |
| 35 | 20 | Nagano | 973 | 1,014 | 49.0 | 51.0 |
| 36 | 13 | Tokyo | 6,960 | 7,218 | 49.1 | 50.9 |
| 37 | 19 | Yamanashi | 389 | 402 | 49.2 | 50.8 |
| 38 | 47 | Okinawa | 722 | 744 | 49.2 | 50.8 |
| 39 | 22 | Shizuoka | 1,740 | 1,787 | 49.3 | 50.7 |
| 40 | 07 | Fukushima | 861 | 881 | 49.4 | 50.6 |
| 41 | 25 | Shiga | 693 | 710 | 49.4 | 50.6 |
| 42 | 12 | Chiba | 3,094 | 3,158 | 49.5 | 50.5 |
| 43 | 10 | Gunma | 937 | 953 | 49.6 | 50.4 |
| 44 | 14 | Kanagawa | 4,576 | 4,649 | 49.6 | 50.4 |
| 45 | 11 | Saitama | 3,640 | 3,691 | 49.7 | 50.3 |
| 46 | 23 | Aichi | 3,717 | 3,742 | 49.8 | 50.2 |
| 47 | 08 | Ibaraki | 1,404 | 1,403 | 50.0 | 50.0 |
| 48 | 09 | Tochigi | 942 | 942 | 50.0 | 50.0 |
1.2 Female ratio by Prefecture - Choropleth Map
2 Data Source
- Ministry of Internal Affairs and Communications
3 Release frequency
- Annually
4 Last updated date
Sys.time()[1] "2026-04-04 17:39:58 JST"6 R & Quarto
R.Version()$version.string[1] "R version 4.5.3 Patched (2026-03-11 r89773 ucrt)"quarto::quarto_version()[1] '1.9.36'